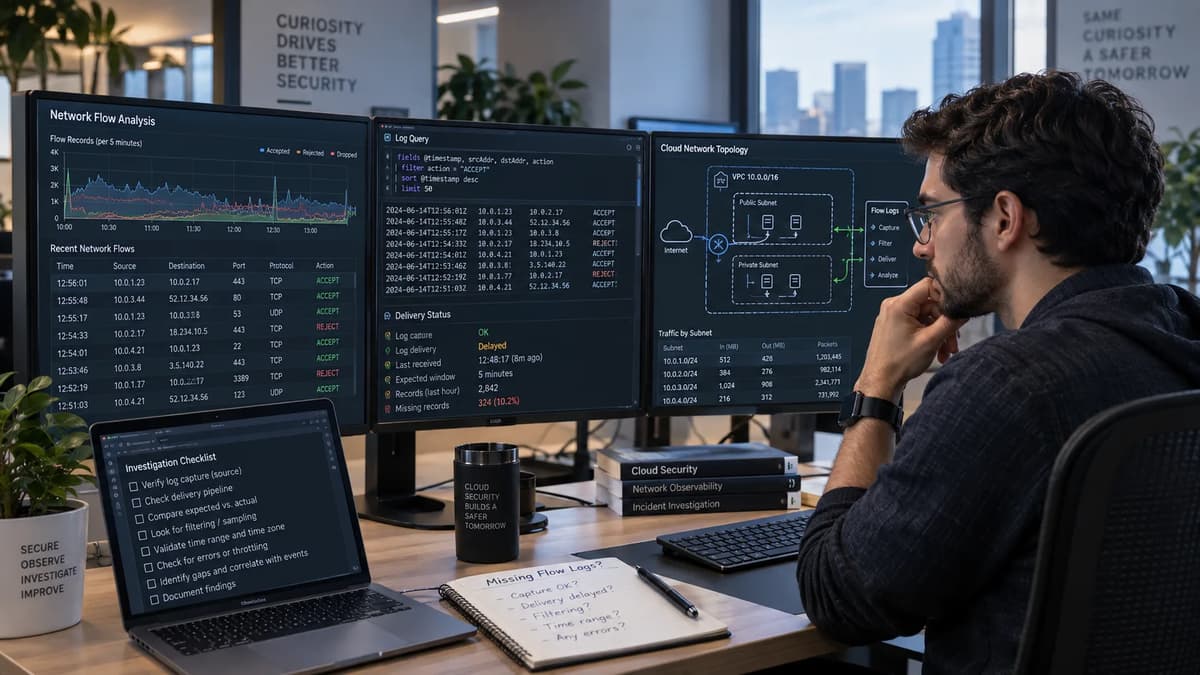
A missing VPC Flow Log record is not, by itself, evidence that a TCP exchange never happened. The gap can come from a different capture scope, a traffic filter that made the flow ineligible, a time-window or parser mistake, a documented exclusion, delayed or failed delivery, or best-effort collection loss. AWS describes VPC Flow Logs as information about IP traffic associated with network interfaces, collected outside the traffic path; it is not packet capture and it is not an application-response log. See the AWS Logging IP traffic using VPC Flow Logs documentation, accessed September 22, 2026.
This playbook is for cloud-security engineers, network operators, and incident responders who need to decide what an empty query result actually supports. The canonical experiment stays deliberately small: one explicitly authorized disposable AWS account or sandbox, one Region, one VPC, one subnet, two EC2 instances with ordinary elastic network interfaces (ENIs), local TCP traffic, CloudWatch Logs, and separately identifiable ALL and REJECT flow-log subscriptions. No NAT gateway, Transit Gateway, load balancer, cross-account delivery, packet inspection, or SIEM rollout is required.
The demonstrations below are a reproducible proposed test with expected assertions, not a report that this environment was executed here. Acceptance therefore depends on replacing placeholders with recorded observations from the authorized run. The output is an evidence ledger and a decision: accept the bounded capture test, classify an expected omission, hold an unsupported traffic-absence claim, repair delivery, or escalate an unexplained gap.
Define the claim that a missing record would need to support
Start with the decision record, not the logging console. Write the incident question in a form that can be falsified: “Did TCP flow X, on ENI Y, in Region R, during interval T, have an eligible record in subscription S and was that record retrievable from destination D?” The unit of analysis is therefore account + Region + ENI + direction + five-tuple + bounded time interval + subscription/filter + destination. AWS documents each flow record as an aggregation of an IP flow characterized by a five-tuple on a per-interface basis, rather than one record per application request. See the AWS Flow log records documentation, accessed September 22, 2026.
Record the claim owner and reviewer as well. The network owner can establish path and ENI identity; the logging owner can establish destination and delivery; the incident reviewer decides whether the evidence is sufficient for the operational conclusion. Minimum corroboration for a traffic-occurrence claim should include an independent sender or receiver observation plus the flow-log evidence when the flow is eligible. A query that returns no matching rows establishes only: no matching record was retrieved by this query from this destination for this window.
Do not silently upgrade that statement to “the exchange did not happen.” This is the same evidence-boundary discipline described in Refonte Learning’s limits of network-health evidence: a telemetry signal supports only the failure domain and interval it actually observes.
Define HOLD before the test begins. Use it whenever capture coverage is not established: no positive control, unknown ENI, uncertain filter, unresolved delivery error, ambiguous query, SKIPDATA, or endpoint evidence that contradicts an empty in-scope ALL result. HOLD is not indecision; it is the correct classification when the available evidence cannot support a traffic-absence claim.
Freeze the capture scope and destination configuration
Before generating traffic, freeze a manifest that another engineer can diff after repair. Record the AWS account ID, explicit Region, VPC and subnet, both instance IDs, both ENI IDs and private addresses, flow-log IDs, traffic types, CloudWatch log groups, publishing-role ARN, record format, configured maximum aggregation interval, log-group retention, UTC clock observations, AWS CLI version, and the experiment repository commit. Record the managed service configuration rather than inventing a “VPC Flow Logs software version”; AWS operates the service, while the locally invoked AWS CLI is the artifact whose version you can actually capture.
A compact manifest is enough:
run_id: flv-20260922-001
account_id: <aws sts get-caller-identity>
region: <explicit-region>
aws_cli_version: <aws --version>
experiment_commit: <git rev-parse HEAD>
vpc_id: <vpc-id>
subnet_id: <subnet-id>
sender: {instance_id: <i-id>, eni_id: <eni-id>, private_ip: 10.42.0.10}
receiver: {instance_id: <i-id>, eni_id: <eni-id>, private_ip: 10.42.0.20}
all_subscription: {flow_log_id: <fl-id>, traffic_type: ALL, log_group: <name>}
reject_subscription: {flow_log_id: <fl-id>, traffic_type: REJECT, log_group: <name>}
max_aggregation_interval_seconds: 60
record_format: "version account-id interface-id srcaddr dstaddr srcport dstport protocol packets bytes start end action log-status flow-direction"
clock_check_utc: <recorded-at-run-time>
AWS’s Create a flow log that publishes to CloudWatch Logs documentation, accessed September 22, 2026, explicitly makes resource, traffic filter, maximum aggregation interval, destination, publishing role, and record format configuration choices. Broader AWS logging design belongs elsewhere; Refonte Learning’s broader AWS security logging foundations provide that wider context, while this test intentionally freezes one ENI-to-CloudWatch path.
Separate subscription status from usable evidence
Treat configuration state and retrieved evidence as two independent observations. AWS’s Troubleshoot VPC Flow Logs guidance, accessed September 22, 2026, notes that a flow log can show Active while no stream or records are yet visible, including while creation initializes or when there has been no recorded traffic.
For acceptance, require a positive-control record that you actually retrieve from the intended log group. “The flow log is Active,” “the log group exists,” and “a stream name is listed” are configuration or destination-state facts; they do not prove that the query, parser, ENI selection, and eligible test traffic line up. Conversely, an empty stream listing is not the same observation as a completed, bounded query that returned zero matching events.
Choose a time window without inventing a delivery SLA
Record endpoint start and end times in UTC, then retain the flow record’s start and end fields separately from CloudWatch event and ingestion times. AWS says the configured maximum aggregation interval is 10 minutes by default or optionally 1 minute, and that Nitro-attached interfaces use intervals of 1 minute or less regardless of the configured maximum. AWS also says CloudWatch delivery is typically about five minutes and is best effort, so logs may arrive later.
Use a local lab waiting budget. For example, poll the bounded query for up to 20 minutes after the test flow ends, but label that as an engineering decision, not an AWS guarantee. The AWS troubleshooting page separately warns that initial creation can in some cases take 10 minutes or more before data appears. If the local deadline expires, the result is HOLD or escalation, not “AWS guaranteed delivery by now, therefore no traffic occurred.”
Build an isolated traffic fixture with an independent oracle
Use an owned disposable account or explicitly authorized sandbox: one VPC such as 10.42.0.0/24, one subnet such as 10.42.0.0/25, and two small EC2 instances. If SSH is required, tightly scope the administration path; the canonical test uses only private instance IPs. There is no NAT gateway, Transit Gateway, load balancer, peering, or cross-account log destination. Select an AMI with Python 3 already present.
Use two restrictive security groups. The receiver allows TCP 18080 only from the sender security group; the sender is allowed to reach the receiver on that port. Administrative SSH, if used, is restricted to the operator’s trusted /32 and is deliberately outside the test five-tuple. Do not open the test port to the internet. Stop if the instances are not disposable, the account is not authorized, the subnet carries shared workloads, or a proposed change would affect a shared IAM role.
Capture identity and time before traffic:
set -euo pipefail
: "${AWS_REGION:?set AWS_REGION}" "${SENDER_ID:?}" "${RECEIVER_ID:?}"
aws --version
aws sts get-caller-identity --output json
aws ec2 describe-instances --region "$AWS_REGION" \
--instance-ids "$SENDER_ID" "$RECEIVER_ID" \
--query 'Reservations[].Instances[].{Instance:InstanceId,PrivateIp:PrivateIpAddress,ENIs:NetworkInterfaces[].NetworkInterfaceId,Subnet:SubnetId,Vpc:VpcId}'
date -u --iso-8601=ns
git rev-parse HEAD
On each instance, also save date -u --iso-8601=ns and, where available, timedatectl show -p NTPSynchronized --value. If synchronization state is unavailable or false, record that limitation; do not manufacture sub-second certainty.
The listener and client below provide the independent oracle. They log a synthetic run identifier in endpoint output, but that identifier is application payload and will not appear as a VPC Flow Log field. Flow Logs expose flow metadata, not arbitrary payload content. AWS describes the service as collecting IP-traffic information associated with interfaces, and record fields contain addresses, ports, protocol, packet/byte counts, times, action, status, and optional metadata rather than application payload.
Receiver:
export LISTEN_IP=10.42.0.20 TEST_PORT=18080 RUN_ID=flv-20260922-001
python3 - <<'PY' | tee "receiver-${RUN_ID}.log"
import datetime, os, socket, sys
ip=os.environ["LISTEN_IP"]; port=int(os.environ["TEST_PORT"]); run=os.environ["RUN_ID"]
s=socket.socket(); s.setsockopt(socket.SOL_SOCKET, socket.SO_REUSEADDR, 1)
s.bind((ip, port)); s.listen(1); s.settimeout(90)
print(datetime.datetime.now(datetime.timezone.utc).isoformat(), "LISTEN", ip, port, flush=True)
try:
c, peer=s.accept(); c.settimeout(10)
data=c.recv(4096)
print(datetime.datetime.now(datetime.timezone.utc).isoformat(), "RECV", peer, c.getsockname(), data.decode(errors="replace"), flush=True)
if run.encode() not in data: raise RuntimeError("run id mismatch")
c.sendall(b"ACK " + data)
finally:
s.close()
PY
Sender, using an explicit source port to make correlation deterministic:
export SRC_IP=10.42.0.10 SRC_PORT=41023 DST_IP=10.42.0.20 TEST_PORT=18080 RUN_ID=flv-20260922-001
python3 - <<'PY' | tee "sender-${RUN_ID}.log"
import datetime, os, socket
src=(os.environ["SRC_IP"], int(os.environ["SRC_PORT"]))
dst=(os.environ["DST_IP"], int(os.environ["TEST_PORT"]))
msg=(os.environ["RUN_ID"]+"\n").encode()
s=socket.socket(); s.settimeout(10); s.bind(src)
try:
s.connect(dst)
print(datetime.datetime.now(datetime.timezone.utc).isoformat(), "CONNECTED", s.getsockname(), s.getpeername(), flush=True)
s.sendall(msg); reply=s.recv(4096)
print(datetime.datetime.now(datetime.timezone.utc).isoformat(), "REPLY", reply.decode(errors="replace"), flush=True)
finally:
s.close()
PY
Preserve both logs unchanged. Receiver RECV plus sender REPLY independently establishes that the controlled application exchange occurred; it says nothing about unrelated packets. Keep the cost boundary explicit: short-lived EC2, any public IPv4 administration, vended-log ingestion, and CloudWatch storage can incur charges. Delete the lab after approved artifacts are exported. AWS notes that vended-log ingestion and archival charges apply.
Establish the ALL-subscription positive control
Create the CloudWatch log group and flow log before sending the positive-control exchange. Scope the flow log to the receiver ENI, not the whole VPC, so the expected observation has one clear capture object. Use a custom format whose order is written into the manifest and a one-minute configured maximum aggregation interval. AWS supports ALL, ACCEPT, or REJECT traffic filters; ALL covers accepted and rejected traffic.
The publishing role must be a dedicated sandbox role or an approved reusable role whose identity is recorded. AWS documents that the role associated with a CloudWatch Logs flow log must be in the account and have sufficient CloudWatch Logs permissions, with a trust relationship allowing vpc-flow-logs.amazonaws.com to assume it. See AWS’s IAM role for publishing flow logs to CloudWatch Logs guidance, accessed September 22, 2026.
set -euo pipefail
: "${AWS_REGION:?}" "${RECEIVER_ENI:?}" "${FLOW_ROLE_ARN:?}" "${RUN_ID:?}"
ALL_GROUP="/lab/vpc-flow/${RUN_ID}/all"
LOG_FORMAT='${version} ${account-id} ${interface-id} ${srcaddr} ${dstaddr} ${srcport} ${dstport} ${protocol} ${packets} ${bytes} ${start} ${end} ${action} ${log-status} ${flow-direction}'
aws logs create-log-group --region "$AWS_REGION" --log-group-name "$ALL_GROUP"
aws logs put-retention-policy --region "$AWS_REGION" --log-group-name "$ALL_GROUP" --retention-in-days 1
ALL_ID=$(aws ec2 create-flow-logs --region "$AWS_REGION" \
--resource-type NetworkInterface --resource-ids "$RECEIVER_ENI" \
--traffic-type ALL --log-group-name "$ALL_GROUP" \
--deliver-logs-permission-arn "$FLOW_ROLE_ARN" \
--max-aggregation-interval 60 --log-format "$LOG_FORMAT" \
--query 'FlowLogIds' --output text)
printf 'ALL flow log: %s\n' "$ALL_ID"
Immediately export describe-flow-logs output for that ID. Then generate one run with the listener and client. The expected receiver-ENI ingress tuple is 10.42.0.10:41023 -> 10.42.0.20:18080, protocol 6, action ACCEPT; the receiver’s reply is the reverse tuple in egress. Do not require a one-to-one mapping between TCP packets and records. AWS says the record aggregates a flow during a capture window, and packet/byte counts are fields inside the record.
The acceptance gate for this stage is stronger than “the flow log is active”: retrieve at least one matching eligible record from the ALL destination, preserve the raw event and query, and correlate it to the endpoint times and five-tuple. If the receiver saw the run but ALL produces no matching record after the local wait budget, stop. Do not proceed as though capture were validated; classify the positive control as unresolved and move to configuration, query, delivery, exclusion, or provider-gap diagnosis.
Make a healthy connection disappear through filtering
Once the ALL positive control is retrievable, add a second, separately identifiable REJECT subscription on the same receiver ENI, with its own CloudWatch log group. Do not change routes, instance addresses, security groups, listener port, or publishing destination class. AWS’s creation documentation defines Reject as logging only rejected traffic, while All logs accepted and rejected traffic. The point of this counterexample is to change eligibility, not the network path.
REJECT_GROUP="/lab/vpc-flow/${RUN_ID}/reject"
aws logs create-log-group --region "$AWS_REGION" --log-group-name "$REJECT_GROUP"
aws logs put-retention-policy --region "$AWS_REGION" --log-group-name "$REJECT_GROUP" --retention-in-days 1
REJECT_ID=$(aws ec2 create-flow-logs --region "$AWS_REGION" \
--resource-type NetworkInterface --resource-ids "$RECEIVER_ENI" \
--traffic-type REJECT --log-group-name "$REJECT_GROUP" \
--deliver-logs-permission-arn "$FLOW_ROLE_ARN" \
--max-aggregation-interval 60 --log-format "$LOG_FORMAT" \
--query 'FlowLogIds' --output text)
printf 'REJECT flow log: %s\n' "$REJECT_ID"
Use a new RUN_ID and a new predetermined source port, for example 41024, so the second exchange cannot be confused with the first. Start the same receiver listener, send the same one-line synthetic payload, and retain both endpoint logs. The successful endpoint exchange should remain mundane: same local subnet, same allowed TCP destination, no routing or policy change.
Record the expected omission before looking at results
Write the prediction into the ledger before querying: “The accepted exchange is eligible for the ALL subscription and ineligible for the REJECT-only subscription.” Also write the failure prediction: “If no matching ALL record is retrieved, the result is unresolved; do not explain it merely because REJECT is empty.” This prevents retrospective story-building around whatever the console happens to show.
The expected result is therefore asymmetric. ALL should eventually expose the accepted ingress and/or egress flow records for the declared ENI and interval. REJECT should contain no record for that accepted five-tuple because the filter excludes accepted traffic. Compare eligibility for the same declared exchange, not total record counts across arbitrary windows that may contain SSH, background traffic, or unrelated rejects.
Distinguish a negative control from a capture failure
An empty REJECT query is a valid negative control only because the independently observed exchange was accepted and the subscription is configured to select rejected traffic. It is not evidence that the sender never connected. The receiver log directly contradicts that traffic-absence claim, while the ALL record provides a positive capture control.
Do not expect ALL and REJECT subscriptions to contain identical rows. Their selection semantics are different by design. Nor should ACCEPT be described as “the application succeeded”: AWS defines ACCEPT as the action associated with traffic accepted by network controls, while the sender’s REPLY and receiver’s receipt are the application-level observations in this fixture.
An optional, separate REJECT positive control may use one authorized TCP attempt to a predeclared receiver port that its security group blocks. Record the port, run ID, expected REJECT, and cleanup; never use third-party targets or shared controls. If that eligible reject is not retrieved, place the REJECT delivery/query path in HOLD.
Interpret OK, NODATA, SKIPDATA, and excluded traffic
log-status is evidence about logging state, not a universal incident verdict. The AWS Flow log records documentation defines OK as data logging normally to the chosen destination, NODATA as no network traffic to or from the interface during the aggregation interval, and SKIPDATA as some records skipped during the interval, potentially because of an internal capacity constraint or internal error. It also states that delivery is best effort.
Observation | Documented meaning | Safe incident interpretation |
OK | Data is logging normally to the chosen destination | Usable status for that record; not proof every historical flow was captured |
NODATA | No traffic to/from that ENI in that aggregation interval | Only scope it to that ENI/interval; reconcile against endpoint evidence and exclusions |
SKIPDATA | Some records were skipped | Capture coverage is degraded; HOLD or escalate for in-scope absence claims |
No matching row | Query retrieved none | Could be filter, window, parser, destination, delay, exclusion, skip, or unexplained gap |
Documented excluded traffic | Flow Logs do not capture that traffic class | Classify as expected omission; seek another evidence source if required |
The AWS Flow log record examples, accessed September 22, 2026, include example NODATA and SKIPDATA rows and note that one skipped record can represent multiple flows that were not captured. Do not try to manufacture AWS internal capacity loss in a lab, and never describe SKIPDATA as attacker activity without independent evidence.
For parser testing, it is fine to create a synthetic local fixture containing invented lines marked OK, NODATA, and SKIPDATA and assert that your classifier maps them correctly. Label those lines as fabricated parser inputs, not captured AWS evidence. Parser validation answers “does our logic recognize these status strings?” It does not establish that the service emitted them in this experiment.
The AWS Flow log limitations documentation, accessed September 22, 2026, describes traffic that Flow Logs do not capture, including traffic to the Amazon DNS server, instance metadata 169.254.169.254, the Amazon Time Sync Service 169.254.169.123, DHCP, ARP, traffic to the reserved default VPC router address, and certain other cases. Do not test sensitive metadata paths or retrieve credentials merely to demonstrate an exclusion. The correct operational lesson is narrower: before turning an empty query into an absence claim, prove that the claimed traffic class was eligible for Flow Logs at all.
Diagnose the publishing path without changing the traffic path
When an endpoint exchange occurred but the expected ALL record is missing, diagnose delivery separately from networking. Start read-only. Export the flow-log object, destination group, publishing role, and CloudWatch group metadata. AWS troubleshooting guidance specifically recommends checking DeliverLogsErrorMessage; documented delivery errors include Rate limited, Access error, and Unknown error. An access error can reflect insufficient CloudWatch permissions or an incorrect trust relationship.
aws ec2 describe-flow-logs --region "$AWS_REGION" \
--flow-log-ids "$ALL_ID" "$REJECT_ID" > flow-logs-before.json
aws logs describe-log-groups --region "$AWS_REGION" \
--log-group-name-prefix "/lab/vpc-flow/${RUN_ID}" > log-groups-before.json
aws iam get-role --role-name "$FLOW_ROLE_NAME" > role-before.json
aws iam list-attached-role-policies --role-name "$FLOW_ROLE_NAME" > attached-policies-before.json
aws iam list-role-policies --role-name "$FLOW_ROLE_NAME" > inline-policies-before.json
The EC2 flow-log API distinguishes flowLogStatus from deliverLogsStatus, and includes fields such as deliverLogsErrorMessage, destination, role ARN, traffic type, format, and maximum aggregation interval. That separation matters: an ACTIVE capture object and a failed delivery status are different facts.
Also separate your permission to inspect CloudWatch from the service role’s permission to publish. A responder who lacks logs:StartQuery or logs:FilterLogEvents may see an access failure even while VPC Flow Logs is publishing correctly. Conversely, a responder with read access can inspect a destination whose publishing role is broken. Record both identities and errors instead of collapsing them into “CloudWatch is down.” This keeps the workflow distinct from management-channel diagnosis as a separate workflow, which addresses EC2 management reachability rather than the flow-log publishing path.
Preserve the failure before applying a repair
Before changing IAM, save the flow-log description, DeliverLogsErrorMessage, role trust policy, attached and inline policy documents, log-group ARN and retention, current time, and the exact missing interval. If the role is shared or ownership is unclear, stop and escalate rather than “fixing” it during evidence collection.
An optional authorization-failure experiment is permitted only in a disposable sandbox role dedicated to a disposable flow log. For example, create a separate test flow log whose role intentionally lacks the documented logs:PutLogEvents permission, then observe whether delivery reports the expected access failure. AWS’s role guidance lists CloudWatch publishing permissions and the vpc-flow-logs.amazonaws.com trust principal. Do not alter an existing shared role, and do not report the failure as observed unless the recorded environment actually produced it.
Use a healthy post-repair control without assuming backfill
Repair only to the previously approved known-good configuration: restore the exact trust and permission document, or recreate a flow log if its immutable configuration itself was wrong. AWS notes that after creation you cannot change a flow log’s configuration or record format; changing those requires deleting and creating a new flow log. Preserve old and new flow-log IDs so the incident interval remains attributable.
After repair, generate a new run identifier and source port, then repeat the endpoint and ALL-query positive control. A newly delivered record establishes that the current publishing path works for the new bounded interval. It does not establish that records missing during the earlier failure were backfilled, nor does it erase the historical gap. Track “observability restored” and “historical evidence recovered” as separate states. If AWS or your retained destination later supplies older events, reconcile them explicitly rather than assuming that post-repair success implied recovery.
Correlate flows without counting requests as log records
A flow record is not an application request ledger. The AWS Flow log records documentation defines the default concept as a five-tuple flow: source address, destination address, source port, destination port, and protocol, on a per-interface basis within an aggregation interval. The start field is the time of the first packet represented in the interval and can have documented timing uncertainty relative to packet transmit or receive time; end has similar bounded timing behavior. Use endpoint UTC timestamps as one clock source and record fields as another; do not force them to be identical.
Direction matters. For the receiver ENI, the client-to-server tuple is ingress. The server-to-client reply is egress with addresses and ports reversed. If your custom format includes flow-direction, use it. If it does not, infer direction only from the ENI address and tuple with a documented rule. Never claim a payload run ID is present in Flow Logs; correlate the run ID indirectly through the endpoint-recorded five-tuple and time window.
Consider a synthetic example: a client opens one TCP connection from 10.42.0.10:41030 to 10.42.0.20:18080 and sends eight small application messages before closing. The receiver might log eight message receipts, while Flow Logs can represent that connection as one aggregated flow record for a direction in a capture window, or more than one if the flow spans aggregation windows. The request count therefore is not an expected flow-record count.
Reject ambiguous correlation. If several clients overlap on the same destination port, source ports are unknown or reused, clocks are badly unsynchronized, or the query window is so broad that multiple candidate flows match, do not pick the most convenient row. Mark the ledger AMBIGUOUS/HOLD, narrow the fixture, and rerun with a controlled source port or otherwise unique tuple.
Audit the query before escalating a missing record
A surprising number of “VPC Flow Logs missing records” cases are query-scope failures. Preserve the exact log group, Region, start and end times, query language, parser, result export, and query completion status. CloudWatch Logs Insights recommends selecting only necessary log groups and the narrowest practical time range, and its parse command can extract fields from @message. The AWS CloudWatch Logs Insights query syntax documentation and parse command documentation explain those mechanics.
Because the custom field order is frozen in the manifest, parse exactly that order rather than assuming every VPC Flow Log group exposes identical discovered field names:
fields @timestamp, @ingestionTime, @logStream, @message
| parse @message "* * * * * * * * * * * * * * *" as version, account_id, interface_id, srcaddr, dstaddr, srcport, dstport, protocol, packets, bytes, start_s, end_s, action, log_status, flow_direction
| filter interface_id = "eni-RECEIVER"
| filter protocol = "6"
| filter (srcaddr="10.42.0.10" and dstaddr="10.42.0.20" and srcport="41024" and dstport="18080")
or (srcaddr="10.42.0.20" and dstaddr="10.42.0.10" and srcport="18080" and dstport="41024")
| sort @timestamp asc
| limit 200
Treat parser failure as a first-class cause. First run fields @timestamp, @ingestionTime, @message | sort @timestamp desc | limit 20 against the intended group. Confirm the raw line actually has the 15 fields in the recorded order. Then add parse, then tuple filters. If raw events exist but parsed fields do not, the capture may be fine and the query wrong.
Verify account and Region from the manifest rather than browser defaults. Verify the selected group corresponds to the intended ALL or REJECT flow-log ID. Expand the query window enough to cover endpoint clock uncertainty, the configured aggregation interval, and delivery delay, but retain the original incident interval separately. Compare flow start_s/end_s, CloudWatch @timestamp, and @ingestionTime rather than treating any one as the sole truth.
Finally, verify retrieval completeness. The CloudWatch GetQueryResults API can return partial results while a query is running and, for Logs Insights QL, supports pagination with nextToken; FilterLogEvents is also explicitly paginated and an empty or partially full page does not end retrieval while a nextToken remains. Preserve the completed query status and all pages. A truncated export is a query artifact, not evidence of absent traffic.
Reconcile each expected observation into an evidence ledger
Do not summarize the test as “logs worked.” Reconcile every expected observation. The ledger keeps missing rows in the denominator and prevents a successful positive control from hiding an unresolved second flow. This is the operational distinction between data collection and interpretation; broader monitoring and logging tool responsibilities are useful context, but the artifact here stays specific to one expected ENI flow.
Use a table like this and attach raw files by immutable artifact name or hash in your incident system:
Expected flow | Eligible subscription | Endpoint oracle | Query window | Observed record/status | Classification | Explanation | Residual uncertainty | Owner |
Sender 41023 → receiver 18080 ingress | ALL | Receiver RECV; sender connected | T0–T1 | Record during execution | MATCHED | Eligible ACCEPT flow retrieved | Best-effort service does not prove all history | Network/logging |
Receiver 18080 → sender 41023 egress | ALL | Sender REPLY | T0–T1 | Record during execution | MATCHED or HOLD | Reverse flow correlation | Clock/aggregation as recorded | Network |
Accepted run 41024 → 18080 | REJECT | Receiver RECV | T2–T3 | None expected | FILTERED | Accepted traffic not eligible for REJECT | REJECT path separately needs positive control if required | Logging |
Claimed metadata/DNS flow | ALL | Independent source | Incident window | None | EXCLUDED if exact AWS exclusion applies | Outside documented capture set | Need alternate evidence | Incident reviewer |
In-scope ALL flow with SKIPDATA overlap | ALL | Endpoint evidence present | Incident window | SKIPDATA | PENDING/HOLD | Records may have been skipped | Missing flow unresolved | AWS/logging |
In-scope ALL flow, delivery failed | ALL | Endpoint evidence present | Incident window | delivery error | REPAIR | Publishing path cannot support absence claim | Historical gap may remain | IAM/logging |
In-scope ALL flow, controls pass, no explanation | ALL | Endpoint evidence present | Incident window | None | UNEXPLAINED | No filter, exclusion, query, or delivery cause found | Provider collection gap possible | Incident lead/AWS |
The classifications are intentionally not all “pass/fail.” MATCHED means the expected eligible observation was retrieved. FILTERED means a subscription intentionally excluded it. EXCLUDED applies only when a documented AWS limitation exactly matches the traffic class. PENDING covers unresolved delay or incomplete evidence. REPAIR means a known publishing problem exists. UNEXPLAINED is reserved for a gap that survives scope, filter, time, query, status, exclusion, and delivery checks.
Preserve the original endpoint files, raw CloudWatch exports, describe-flow-logs snapshots, IAM policy/trust snapshots, query text, query output, CLI version, clock observations, and commit. The evidence ledger should point to those artifacts rather than paraphrasing them away.
Decide what can be accepted and what must remain open
The decision matrix should answer a narrow question: is the bounded capture test good enough to support its stated operational conclusion? It must not turn one successful experiment into proof that every historical packet was captured.
Evidence state | Decision | What you may conclude | What you may not conclude |
ALL positive control retrieved; accepted run absent only from REJECT as predicted; no unresolved in-scope gaps | ACCEPT bounded test | Configuration, delivery, query, and filter behavior worked for the tested scope/interval | Complete historical capture; application security; absence of malicious traffic elsewhere |
Missing row exactly explained by traffic filter or documented exclusion | CLASSIFY expected omission | The chosen subscription/capture scope was not eligible to show that observation | The traffic did not occur |
No positive control, ambiguous tuple/window, SKIPDATA, unknown ENI, or insufficient inspection permission | HOLD | Evidence is insufficient for the proposed absence claim | “No flow means no traffic” |
Delivery status/error or IAM destination failure explains missing records | REPAIR delivery | Logging path was impaired | Earlier records will necessarily backfill |
Endpoint proves in-scope eligible traffic; ALL controls otherwise pass; query/delivery/exclusion checks do not explain absence | ESCALATE unexplained gap | A bounded collection gap remains unexplained | Attacker action, provider root cause, or universal logging failure without further evidence |
Require both a functioning positive control and no unresolved in-scope ledger row before accepting the proposed lab. If the positive control is missing, the experiment does not establish capture coverage even when every console status looks green. If REJECT lacks the accepted flow while ALL contains it, that is the intended counterexample, not a fault.
The wording in an incident channel should remain similarly bounded: “For receiver ENI eni-X, TCP tuple Y during interval Z was independently observed and retrieved from the ALL subscription; the same accepted tuple was not eligible for the REJECT-only subscription.” That is defensible. “Flow Logs are complete” or “there was definitely no other traffic” is not.
Recover the logging path and retain the incident gap
Recovery restores observability; it does not retroactively repair the evidentiary record unless older events are actually recovered and verified. Before any change, export the failing flow-log object, destination metadata, role configuration, query results, and missing interval. Then execute the smallest reversible correction that returns the path to the approved manifest.
A safe restoration sequence is:
1. Freeze the incident interval and artifact set; assign an owner to the unresolved gap.
2. Compare current flow-log ID, ENI, traffic type, format, aggregation setting, destination group, and role ARN with the known-good manifest.
3. If IAM publishing is wrong, restore the approved trust or permissions on the dedicated role. If the flow-log configuration itself is wrong, create a replacement with the intended immutable configuration rather than trying to mutate unsupported fields. AWS documents that flow-log configuration and record format cannot be changed after creation.
4. Verify describe-flow-logs again and save the post-change snapshot.
5. Generate a new synthetic run with a new run ID and source port; retrieve its ALL record and, where relevant, repeat the REJECT negative control.
6. Keep the earlier interval explicitly marked GAP-UNRESOLVED, GAP-EXPLAINED, or GAP-RECOVERED based on evidence actually available.
7. Export approved artifacts before deleting CloudWatch groups, flow logs, instances, public addresses, test security groups, and disposable IAM resources.
Do not change the application traffic path merely to make logging look healthy. If the two EC2 instances can still exchange the allowed TCP test but logging delivery is broken, the business path and telemetry path are already isolated failure domains. Preserve that isolation during diagnosis.
If the service is currently impacted for a reason outside this lab, prioritize safe service recovery under the production incident plan. This playbook does not justify prolonging impact to preserve perfect telemetry. It does require responders to record which evidence was lost when a recovery action destroys or changes state.
Cleanup should be deliberate, not a blind teardown. Confirm that the endpoint logs, raw CloudWatch events, query files, flow-log snapshots, manifest, and reviewer decision have reached the approved evidence store. Then delete disposable flow logs and groups, terminate instances, release public IPv4 resources, and remove only IAM roles and policies proven to belong to this lab. Re-run the resource manifest after cleanup so the lab itself does not become an abandoned logging or cost artifact.
Assign ownership and recurring capture checks
A missing-record incident usually crosses at least four ownership domains. Network engineering owns the ENI, subnet, security-group intent, tuple, and path. IAM owns or reviews the publishing role and trust. The logging platform owner owns CloudWatch destination access, retention, and query tooling. The incident reviewer owns the evidentiary conclusion and makes sure an empty result is not translated into a stronger claim than capture coverage supports.
For organizational handoff patterns beyond this narrow ENI workflow, Refonte Learning’s incident-response ownership and handover article provides broader process context. Here, the recurring control should remain small enough to run and review: one authorized TCP positive control against a designated test ENI, one recorded ALL retrieval, one filter-negative assertion, and a saved manifest/query packet.
Set recurrence by your operational risk and change cadence, not as though AWS prescribed a universal schedule. Reasonable triggers include creating or replacing a flow-log subscription, changing its destination or role through recreation, changing query/parser code, moving a workload to a new ENI or subnet, rotating logging ownership, or discovering a missing-record incident. A calendar check can supplement those triggers, but it is your control design, not an AWS delivery guarantee.
Define escalation triggers in advance: SKIPDATA overlapping a material incident; repeated in-scope ALL gaps with endpoint proof; unexplained DeliverLogsErrorMessage; inability to inspect the configured destination; configuration drift with unknown owner; or a provider-support case that needs account, Region, ENI, flow-log ID, timestamps, raw records, and reproducible positive controls. Do not send credentials or unrelated customer data in that packet.
Retention policy should preserve enough evidence to review both the test and the incident decision. At minimum keep the manifest, exact query, raw result, endpoint logs, flow-log configuration snapshots, relevant IAM policy/trust snapshots, clock notes, commit, decision matrix row, and reviewer. The retention duration is an organizational policy choice governed by incident, legal, privacy, and cost requirements; this lab does not define an enterprise logging architecture.
Build cloud-security skills around evidence-based decisions
The durable skill is not memorizing where the Flow Logs console button lives. It is learning to separate configured control, eligible observation, delivered evidence, and incident conclusion. In this playbook, an accepted TCP exchange can be present in ALL and correctly absent from REJECT; a publishing failure can create a different empty result; and an unresolved ALL gap must remain open rather than being converted into “traffic never happened.” Those are evidence-quality decisions as much as AWS configuration decisions.
Refonte Learning’s Cloud Security Engineer Essentials page lists a three-month program at 10–12 hours per week and includes cloud monitoring and logging plus incident-response planning among its published competencies. Those are relevant foundations for engineers who need to make scoped, auditable decisions from cloud telemetry, though this exact VPC Flow Logs laboratory is not presented here as confirmed curriculum.
The operational standard to carry forward is simple: a configured flow log is not the same thing as a tested observation, and an empty observation is not automatically evidence of absent traffic. Close the incident claim only when scope, eligibility, endpoint evidence, delivery, query behavior, and residual uncertainty have all been reconciled in the ledger.