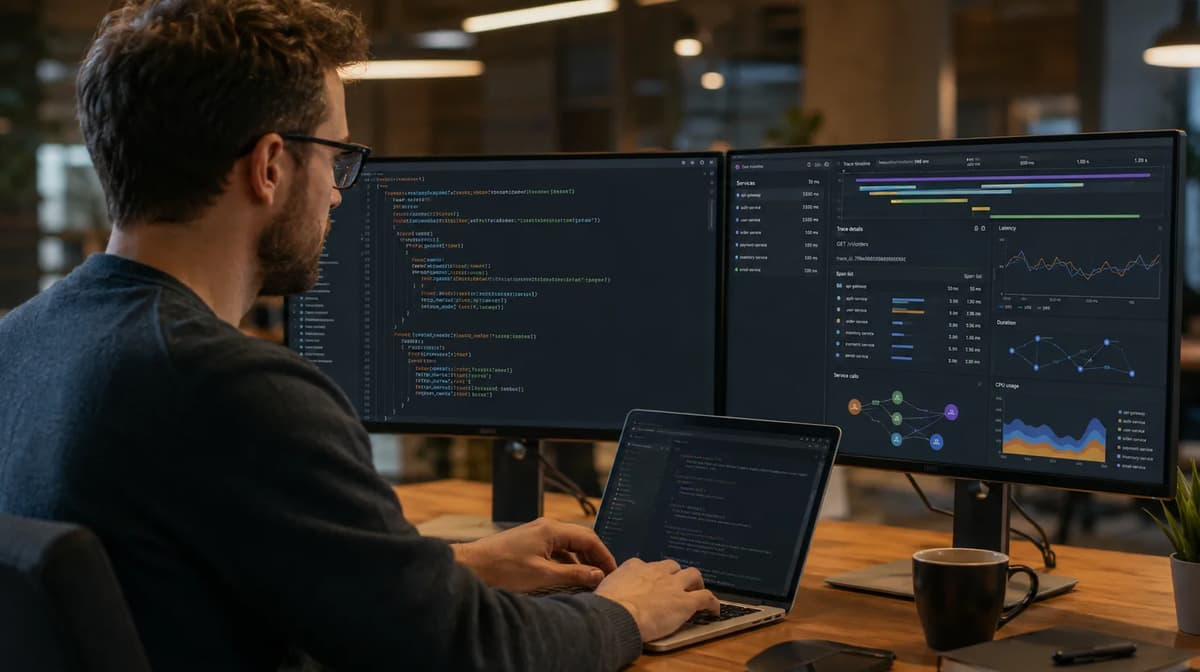
OpenTelemetry graduating from the Cloud Native Computing Foundation is not infrastructure news you can safely hand off to the platform team. The OpenTelemetry CNCF graduation in 2026 matters to backend developers because it says something concrete about the standard against which you increasingly instrument your own application code: its governance, security review, ecosystem scale, and production maturity have crossed CNCF's highest project-maturity threshold. CNCF announced the graduation on May 21, 2026, at the Observability Summit in Minneapolis.
That does not mean every OpenTelemetry feature is finished. It certainly does not mean that every company has replaced its existing APM stack with one clean OpenTelemetry pipeline: a 2026 CNCF-hosted analysis found 46.7% of surveyed organizations still operating two or three observability tools in parallel, while only 7.4% reported a single unified observability experience.
More importantly for you, this is not another “what is observability?” article and it is not a tour of dashboards, alert rules, Collector deployments, or incident-management workflows. Refonte Learning already covers what observability actually means in a DevOps context; here, the focus is the earlier decision made inside the application: where should you create a span, what should that span represent, which attributes make it useful, and what should you instrument first?
That distinction matters because automatic instrumentation can tell you that Express handled a request, PostgreSQL executed a query, or an HTTP client contacted another service. Only the developer who understands the business operation can reliably describe why the request existed, which domain step failed, whether an attempted operation reached a meaningful state transition, or what an LLM call was supposed to accomplish. OpenTelemetry's JavaScript documentation explicitly supports creating application spans with startActiveSpan, while Honeycomb's OpenTelemetry documentation describes using automatic instrumentation as scaffolding on top of which developers add instrumentation for their own business logic.
The practical change in 2026 is that this application-level skill now sits on top of a significantly more mature foundation. Declarative configuration reached stable status in March, Profiles entered public alpha later that month, GenAI semantic conventions now give AI-backed services a common telemetry vocabulary, and commercial vendors are reorganizing their products around accepting OpenTelemetry data rather than requiring a completely separate instrumentation path.
The rest of this guide is about what those developments mean when you are the person writing the backend service.
OpenTelemetry Just Became a CNCF Graduated Project
CNCF announced OpenTelemetry's graduation on May 21, 2026, at the Observability Summit in Minneapolis. By that point, the project had accumulated more than 12,000 contributors from more than 2,800 companies and ranked second in project velocity across more than 240 CNCF projects, behind only Kubernetes.
A useful way to interpret the CNCF maturity ladder is not as a popularity ranking but as a progression in confidence about whether a project can sustain real production dependence.
CNCF maturity level | Practical signal to a backend team |
Sandbox | Experimental or early-stage technology whose adoption and operational model are still developing |
Incubating | Real production adoption and a growing contributor ecosystem, but governance and maturity are still developing |
Graduated | Stable, broadly adopted, production-ready technology with mature project governance; OpenTelemetry's graduation review also included independent security and governance reviews |
For OpenTelemetry specifically, CNCF says graduation followed a third-party independent security audit, reviews of core components including the Collector, and a formal governance review. Graduation therefore tells you more than “developers like this project”: it tells an engineering organization that external scrutiny has been applied to the project's security and governance before CNCF elevated it to the foundation's highest maturity tier.
That is relevant when you put an instrumentation API directly into application code. Instrumentation can become unusually sticky: span creation ends up in request handlers, domain services, database abstractions, queue consumers, SDK wrappers, and shared libraries, so changing instrumentation strategies later can touch far more code than swapping a dashboard tool.
OpenTelemetry was designed to reduce that coupling. CNCF describes the project as providing APIs, SDKs, the Collector, and semantic conventions that let organizations change analysis backends without having to re-instrument the entire application estate. That does not make backend migration free: pipeline configuration, vendor-specific features, pricing models, sampling strategies, and query languages still differ, but it creates a standard boundary between the code producing telemetry and the product consuming it.
The scale behind the graduation is also difficult to dismiss as a niche cloud-native metric. During the 12 months preceding the announcement, CNCF reported more than 1.36 billion downloads of the OpenTelemetry JavaScript API package and more than 1.3 billion downloads of the Python API package, with both reaching monthly download records in April 2026. Those are package-download events rather than counts of unique developers or production services, so you should not treat 1.36 billion as “1.36 billion users,” but they do establish the scale at which the APIs are now distributed.
For a backend developer choosing a tracing API today, that maturity affects the risk calculation. You are no longer evaluating only whether a particular vendor has a convenient tracing library; you are deciding whether the telemetry vocabulary embedded in your code should belong to the application or to whichever APM vendor the company happens to use this year.
That is the more useful interpretation of OpenTelemetry vs proprietary APM. OpenTelemetry does not make Datadog, Honeycomb, New Relic, or another observability backend unnecessary; it gives your application a vendor-neutral instrumentation layer that those products can increasingly consume. Current Datadog, Honeycomb, and New Relic documentation all describe direct OpenTelemetry integration, although their analysis experiences remain vendor products with their own capabilities and economics.
Graduation also does not certify that every OpenTelemetry subsystem has the same maturity. Profiles, for example, became public alpha only two months before graduation, and OpenTelemetry explicitly warns against using that alpha signal for critical production workloads. A graduated umbrella project can continue to contain features at earlier specification maturity levels.
That distinction is essential. Treat the May milestone as evidence that the project itself has mature adoption, security review, and governance, not as a blanket promise that any OpenTelemetry feature you encounter is automatically production-stable.
The annual adoption numbers reinforce that mixed picture. CNCF published its Annual Cloud Native Survey on January 20, 2026, and CNCF CTO Chris Aniszczyk highlighted its OpenTelemetry figures: 49% reported production usage and 26% reported evaluating the project.
That is substantial production adoption, but it leaves a meaningful portion of the market elsewhere. Graduation should increase your confidence in the instrumentation contract; it should not make you assume the company you join tomorrow has a clean, unified OpenTelemetry architecture.
What Graduation Means When You Instrument Your Own Code
The most important ownership boundary in observability is easy to blur. A platform engineer can provision a Collector, configure exporters, maintain an APM account, operate telemetry storage, and define organization-wide retention policies; that person cannot infer the domain semantics hidden inside your placeOrder(), approveLoan(), reserveInventory(), or generateRecommendation() function.
For a backend developer, the division looks more like this:
Question | Backend/application owner | Platform/DevOps/SRE owner |
What business operation deserves a span? | Primary owner | Can advise |
What should that span be called? | Primary owner | Can define naming standards |
Which business attributes make failure diagnosable? | Primary owner | Can enforce privacy/cardinality policy |
How does trace context reach standard libraries? | Shared; often automatic instrumentation | Shared |
Where does OTLP data get exported? | Usually not the business-logic concern | Primary owner |
Collector deployment and scaling | Usually consumes platform contract | Primary owner |
APM dashboards, retention and alert routing | Participates | Usually primary owner |
Root cause inside domain logic | Primary owner | Collaborates |
This is why reading a distributed trace and writing useful spans are different skills. You can become competent with an APM user interface without ever deciding where one unit of business work starts and ends.
OpenTelemetry's Node.js documentation distinguishes tracer.startSpan() from tracer.startActiveSpan(). The latter creates a span and activates its context for the callback, and the documentation recommends it for most application cases because child operations can then inherit the active context.
A simplified application-level example looks like this:
import { trace, SpanStatusCode } from '@opentelemetry/api';

const tracer = trace.getTracer('checkout-service');

async function checkout(cart, paymentProvider) {
  return tracer.startActiveSpan('checkout.place_order', async (span) => {
    try {
      span.setAttribute('app.checkout.item_count', cart.items.length);
      span.setAttribute(
        'app.checkout.payment_provider',
        paymentProvider
      );

      const order = await placeOrder(cart);

      span.setAttribute('app.checkout.result', 'created');
      return order;
    } catch (error) {
      span.recordException(error);
      span.setStatus({ code: SpanStatusCode.ERROR });
      throw error;
    } finally {
      span.end();
    }
  });
}
The significant part is not the six OpenTelemetry method calls. The engineering decision is that checkout.place_order represents a business operation worth seeing as one causal unit.
I would not start by creating a span around every helper function. A trace in which parsePayload, mapObject, buildOptions, getValue, and formatDate each produce a span is technically detailed but often semantically useless; it buries the operations whose latency and failures actually affect users.
My normal first-pass questions are therefore:
Which request represents a core customer action?
Which domain transition would I need to identify immediately during a production failure?
Which external dependency can turn an otherwise healthy request into a slow or failed one?
Where does work leave the current process through HTTP, a database, a message broker, or an LLM API?
Which step would I otherwise have to reconstruct from five log statements?
That is instrumenting application code with OpenTelemetry rather than merely enabling an agent. Automatic HTTP, Express, database, and client instrumentation remains useful because it supplies the structural skeleton; manual instrumentation adds the domain landmarks that turn that skeleton into a debugging narrative. Honeycomb's current documentation makes the same distinction explicitly: basic automatic instrumentation provides events for recognized packages, while developers can add fields and instrumentation for their own service's business logic.
This article deliberately stops at that application boundary. Readers looking for Collector architecture, dashboard strategy, alerting, and infrastructure signals should use Refonte Learning's guide to the broader observability landscape for infrastructure and platform teams, because those are different implementation responsibilities.
Two common backend mistakes follow directly from confusing the boundaries.
Instrumenting everything at once is the first. The fix is to instrument one or two business-critical request paths, verify that the resulting traces answer real debugging questions, then expand deliberately.
Treating instrumentation as a DevOps-only concern is the second. Your platform team can give you a configured tracer and telemetry path; it cannot know that payment.authorize matters more than PaymentHelper.execute, that inventory.reserve should be distinguishable from inventory.read, or that a model fallback is a business outcome rather than an ordinary HTTP 200.
Graduation makes the underlying standard less risky. It does not remove the application-design decisions required to produce good telemetry.
Declarative Configuration and Profiles: What Actually Changed in 2026
Two OpenTelemetry milestones landed in March 2026 that deserve more attention from backend developers than they have received: OpenTelemetry declarative configuration reached stable status on March 5, and the OpenTelemetry Profiles signal entered public alpha on March 26. They solve very different problems.
2026 milestone | Maturity at announcement | Backend-developer consequence |
Declarative configuration | Key specification portions stable | More SDK behavior can move out of application source code into standardized configuration |
Profiles | Public alpha | OpenTelemetry is extending beyond traces/metrics/logs toward continuous code-level performance profiles |
Declarative implementations | Available in C++, Go, Java, JavaScript and PHP on March 5 | Polyglot teams gain a common configuration model |
eBPF profiling agent | Integrated with Collector ecosystem in alpha | Linux services can collect low-overhead whole-system profiles without adding manual profiling code to every runtime |
The declarative-configuration announcement marked the JSON schema data model at version 1.0.0 as stable, along with its YAML representation, parsing and SDK-creation operations, plugin-component references, and the OTEL_CONFIG_FILE environment variable used to identify a configuration file. At the March 5 announcement, implementations were available in C++, Go, Java, JavaScript, and PHP, while .NET and Python implementations were still under development.
The backend value is separation of concerns. Historically, a team could end up treating exporter initialization, processor setup, resource configuration, or related telemetry behavior as ordinary application bootstrap code; changing observability behavior could then mean changing source, rebuilding an artifact, passing code review, and pushing another application release.
A stable declarative model lets more of that SDK setup live in a standardized JSON/YAML-shaped configuration layer. The OpenTelemetry team describes the model as providing a substantially richer configuration language than the environment-variable mechanisms available before it and as a way to make configuration more consistent across language implementations.
For the developer who currently receives “can you change the telemetry setup?” tickets, that is more important than it sounds. The design direction creates a cleaner boundary between what your code says is important (the spans, metrics, and attributes) and how the deployment exports and processes that telemetry.
There is one nuance I would insist on in a production design review: declarative does not automatically mean dynamically hot-reloadable. Stable schema-driven configuration can remove a source-code change and application rebuild without guaranteeing that every SDK can apply every configuration change to a running process without restart or redeployment.
That distinction prevents an architecture team from overselling the March milestone. The practical win is that telemetry configuration can increasingly be externalized from your business source code; you still need to check your chosen SDK's lifecycle behavior before promising zero-restart runtime changes.
Profiles is more experimental but conceptually larger. OpenTelemetry described the March 26 alpha as an effort to establish a unified industry standard for continuous production profiling, standing alongside traces, metrics, and logs.
A trace answers questions such as:
Which operation delayed this request, and what dependency or child span consumed the elapsed time?
A profile answers a different class of question:
While this service was running, which functions and call stacks actually consumed CPU time?
Those questions overlap without being interchangeable. A span may tell you that recommendations.rank_candidates took 480 milliseconds; a CPU profile can help reveal whether that time came from serialization, regex work, a ranking loop, garbage collection pressure, a library routine, or another code path inside the span.
The alpha included an eBPF-based profiling agent integrated as an OpenTelemetry Collector receiver. OpenTelemetry says the agent supports low-overhead whole-system profiling on Linux across common language runtimes and ships in an official Collector distribution; the alpha also added runtime-specific improvements including Node.js V8 ARM64 and .NET support.
For backend developers, the architectural opportunity is signal correlation. OpenTelemetry is working toward profiles that coexist with the same broader telemetry model as traces, so an investigation can move from “this request span is expensive” toward “here is where the process spent its execution time,” rather than treating APM traces and a separate profiler as completely unrelated datasets.
But do not deploy Profiles merely because OpenTelemetry itself has graduated. The Profiles team explicitly states that the signal's alpha status means it should not be used for critical production workloads.
For your 2026 skills plan, that means declarative configuration deserves practical experimentation now; Profiles deserves technical awareness and controlled experimentation, not an assumption of production stability.
GenAI Semantic Conventions and the Vendor Shift Around OpenTelemetry
The OpenTelemetry development most directly connected to new backend business logic is the standardization of telemetry for GenAI and LLM operations. OpenTelemetry's GenAI conventions define a shared vocabulary for recording which model was invoked, how tokens were used, why generation ended, and, when explicitly enabled, information about prompts, responses, tool calls, and tool results.
That turns an LLM call from an opaque outbound HTTP span into an application operation with domain-relevant telemetry.
OpenTelemetry GenAI attribute | What it can tell your backend code |
gen_ai.request.model | Which requested model handled the operation |
gen_ai.usage.input_tokens | Tokens consumed by input/prompt processing |
gen_ai.usage.output_tokens | Tokens generated in the response |
gen_ai.response.finish_reasons | Why generation stopped |
gen_ai.operation.name | The type of GenAI operation, such as chat or content generation |
gen_ai.provider.name | The provider/system associated with the operation |
The current OpenTelemetry registry contains attributes including gen_ai.request.model, gen_ai.usage.input_tokens, gen_ai.usage.output_tokens, and gen_ai.response.finish_reasons. The registry now points these entries toward a dedicated OpenTelemetry GenAI semantic-conventions repository, reflecting the conventions' evolution into their own specialized specification area.
For a backend service that calls a model to classify a support request, extract structured data, rank candidates, generate text, or run an agent workflow, these fields matter because model behavior becomes part of the application's behavior. Latency without model identity is incomplete; token consumption without the operation that caused it is hard to optimize; a truncated response without a finish reason can look like an ordinary success.
This is a classic application-instrumentation problem rather than an infrastructure problem. The Kubernetes cluster does not know why you called the model, and the HTTP proxy does not know whether the resulting completion represented a successful business outcome.
There is also a privacy boundary you need to own. OpenTelemetry's GenAI registry warns that input and output message attributes can contain sensitive information, including user or personally identifiable data, and supports filtering or truncation approaches; capturing prompt and response content should therefore be an explicit data-governance decision rather than a default “more telemetry is better” choice.
A sensible application span might therefore capture model, provider, operation type, token counts, latency, finish reason, and an application-defined outcome while leaving raw prompt content disabled.
This is also where vendor behavior in 2026 becomes strategically interesting.
Vendor | Current OpenTelemetry positioning | Evidence |
Datadog | Explicitly markets an “OpenTelemetry-native” workflow and accepts OTel data into APM/LLM experiences | Datadog 2026 documentation |
Honeycomb | Recommends OpenTelemetry for instrumenting applications and supports adding application business logic | Honeycomb current documentation |
New Relic | Publicly describes a “First-Class OpenTelemetry” strategy covering app instrumentation and telemetry pipelines | February 2026 announcement |
Datadog's January 2026 Open Source Hub reported native support for OpenTelemetry's GenAI semantic conventions, allowing standardized GenAI spans to feed its LLM/agent observability tooling. Its current mapping recognizes fields such as gen_ai.request.model and input-token attributes, while a July 2026 product article explicitly describes an “OpenTelemetry-native” path from ingestion through investigation.
A date nuance matters here: Datadog's underlying feature post predates the January roundup, so the safest statement is that by January 2026 Datadog was documenting the native support as released, rather than pretending the roundup itself proves the original release happened during that month. The technical support is clear; the distinction simply avoids manufacturing a launch date from a summary post.
Honeycomb's current application-ingestion documentation tells users to instrument applications with OpenTelemetry and recommends it for first-time instrumentation. Its instrumentation guide goes further and explicitly describes adding instrumentation around your own service's business logic on top of automatic instrumentation.
New Relic announced on February 24, 2026 that it was “doubling down” on First-Class OpenTelemetry, with releases spanning application instrumentation, infrastructure, hybrid agents, and Collector visibility.
The inference for backend developers is not that these vendors have become interchangeable. They have not.
The stronger conclusion is that the instrumentation layer is becoming a competitive integration point. Vendors increasingly have an incentive to consume OpenTelemetry correctly because customers want to instrument application code without permanently binding every business span to one proprietary API. That multi-vendor convergence is directly supported by the vendors' own 2026 product documentation.
And yet the fragmentation numbers prevent a victory lap: a February 2026 industry survey discussed by CNCF found 46.7% still using two or three observability tools, with only 7.4% reporting full unification. Standardized instrumentation and a standardized buying environment are not the same thing.
What the Adoption Numbers Show: What You Should Instrument First
There are two different 2026 adoption stories, and they should not be collapsed into one survey.
The CNCF Annual Cloud Native Survey, published January 20, reported an OpenTelemetry adoption picture that CNCF CTO Chris Aniszczyk summarized as 49% using OpenTelemetry in production and 26% evaluating it. Separately, a May 2026 CNCF article analyzed a February survey of 407 DevOps engineers, SREs, platform engineers, cloud architects, and engineering leaders and reported the 46.7% multi-tool and 7.4% unified-stack figures.
2026 evidence | Result | What it actually tells you |
CNCF Annual Cloud Native Survey | 49% production OpenTelemetry use | Production adoption is substantial |
CNCF Annual Cloud Native Survey | 26% evaluating | A large additional population is still in adoption decisions |
February industry survey discussed by CNCF | 46.7% use 2–3 observability tools | Standardized instrumentation has not eliminated tool overlap |
Same February survey | 7.4% report one unified experience | Full consolidation remains uncommon |
OTel Collector follow-up survey | 81% deploy Collectors on Kubernetes | Kubernetes dominates Collector deployment among respondents |
OTel Collector follow-up survey | 51% use VMs | VM deployments remain significant |
OTel Collector follow-up survey | 65% run more than 10 Collectors | Collector deployments have reached meaningful operational scale |
OTel Collector follow-up survey | 46% build a custom Collector | Customization is widespread |
OTel Collector follow-up survey | 39% confidently called Collector Builder easy | Builder UX still has clear room to improve |
The Collector figures come from OpenTelemetry's January 28, 2026 analysis of its 2025 follow-up survey. It found 65% running more than 10 Collectors, 81% using Kubernetes, and VM usage at 51%, while the share building their own Collector reached 46%.
The usability result deserves precise wording. The survey does not say that 61% explicitly found Collector Builder difficult; it says only 39% confidently agreed it was easy, leaving 61% neutral or negative, while roughly 25% of custom-builder users specifically reported it as hard to use. That distinction matters when you are using survey evidence rather than marketing copy.
Production adoption and operational friction can both be true. Graduation does not mean the OpenTelemetry experience has become frictionless.
Fortunately, none of that should change where a backend developer starts.
For instrumenting application code with OpenTelemetry, I would normally use this order:
Instrumentation priority | Example | Why start here |
First | Core user-facing request | Establishes the business operation users actually experience |
First | Major domain transition | Shows where the application's meaningful state changes |
First | Database or external API dependency | Isolates latency and failure outside the current function |
First | LLM/model call | Exposes model latency, tokens, outcome and finish behavior |
Next | Queue publish/consume boundary | Preserves causal understanding across asynchronous work |
Next | Expensive internal computation | Useful when a meaningful operation can be isolated |
Later | Low-value helpers | Add only when they answer a demonstrated debugging question |
Suppose you own an order service. I would rather have five well-designed spans called order.submit, inventory.reserve, payment.authorize, order.persist, and confirmation.publish than 150 spans mechanically copied around every method.
Those five names give you a business narrative. When one request takes three seconds, you immediately have a chance of determining whether payment, inventory, persistence, or messaging explains it.
The same logic applies to attributes. Put data on a span because it answers a question you can imagine asking under pressure, not because the API gives you a setAttribute() method.
For example, payment.provider, inventory.reservation_result, order.channel, gen_ai.request.model, or an application-defined retry category may explain materially different execution paths. A raw password, authorization token, full customer prompt, or other secret does not become safe merely because the destination is an observability system; OpenTelemetry's GenAI conventions explicitly warn about the sensitive nature of model-message content.
Then test the trace against a concrete failure scenario:
1. Can I identify the business operation that failed?
2. Can I see where time was spent?
3. Can I distinguish dependency failure from my own logic?
4. Can I tell which important execution branch occurred?
5. Can I correlate downstream work without hunting manually through unrelated logs?
If the answer is no, adding more spans indiscriminately is usually the wrong first response. Improve the semantic boundary.
Declarative configuration strengthens this incremental approach. You no longer need to treat every observability setting as immutable application code, so you can keep business instrumentation relatively stable while evolving the surrounding SDK configuration as your telemetry strategy matures.
That is also why the correct prerequisite is not “master Datadog” or “master Grafana.” It is understanding request boundaries, APIs, databases, asynchronous work, failure handling, and debugging, the service fundamentals laid out in the full 2026 backend development mastery roadmap.
A platform may change. The fact that payment.authorize is a meaningful boundary in your application does not.
Backend Developer Skills, Certifications, Portfolio Signals, and Demand
OpenTelemetry belongs on a backend developer skills 2026 list, but the ordering matters. Memorizing every Collector processor is less valuable to an application developer than being able to look at a request path and decide what deserves instrumentation.
Priority | Skill |
Must | Write a trace span directly in your own application code |
Must | Choose business-critical paths instead of instrumenting everything |
Must | Understand trace context across service and async boundaries |
Should | Add useful business attributes without leaking sensitive data |
Should | Understand declarative configuration well enough to separate code from telemetry setup |
Should | Know GenAI semantic conventions when your backend invokes LLMs |
Good | Understand what Profiles can reveal beyond traces, metrics and logs |
Good | Evaluate vendor “OTel-native” claims without assuming vendors are interchangeable |
Writing a span ranks first because it forces you to understand the application's execution model. You have to know where the operation begins, what work belongs inside it, where context must propagate, which failures are meaningful, and which fields explain behavior.
There is also an important correction to a claim you may encounter in older career guidance: there is now a dedicated OpenTelemetry certification.
The CNCF/Linux Foundation OpenTelemetry Certified Associate (OTCA) validates foundational OpenTelemetry knowledge. CNCF describes it as covering collection of traces, metrics and logs and positioning the credential particularly for DevOps, SRE and cloud-engineering contexts.
OpenTelemetry's own certification overview lists the exam blueprint as 18% observability fundamentals, 46% OpenTelemetry API and SDK, 26% Collector, and 10% maintaining/debugging observability pipelines. It therefore does test application-instrumentation knowledge; it would be inaccurate in 2026 to say no OpenTelemetry certification exists.
But OTCA is not a backend-business-logic performance exercise. It covers a broader observability domain, including the Collector and pipeline concerns, and CNCF itself frames the certification around roles including DevOps, SRE and cloud engineering.
For a backend portfolio, I would pair certification knowledge with something more concrete:
A small service with automatic HTTP/database instrumentation plus manually designed business spans.
A README explaining why those span boundaries were chosen.
One deliberately reproduced slow or failed request and the trace that identifies it.
A comparison showing what the framework-level trace revealed before manual instrumentation and what became visible afterward.
For an AI project, GenAI attributes for model and token usage without indiscriminately storing private prompt content.
That artifact answers a hiring manager's real question: can you instrument software that you understand?
Current job advertisements show that this distinction appears in actual backend hiring language. A live Simulmedia Senior Backend Engineer listing asks for working knowledge of OpenTelemetry and related tooling, explicitly including “setting up tracing, metrics, and alerting, not just consuming dashboards.” A current Tala Senior Backend Engineer listing lists familiarity with production monitoring and OpenTelemetry among its desired experience.
Those two postings do not prove that every backend role now requires OpenTelemetry, nor do they establish a statistically measured year-over-year hiring trend. They do prove the narrower and more defensible point: current backend roles exist in which observability and OpenTelemetry are named separately as engineering skills rather than being assumed to belong exclusively to SRE.
Salary data should be treated with similar discipline. Current U.S. salary trackers vary dramatically according to title, source, geography, and whether they report base or total compensation: as of August 2026, Glassdoor shows roughly $178,000 median total pay for “Backend Engineer,” while ZipRecruiter's August 14 figure for “Backend Developer” is $120,086 average annual pay.
That gap is exactly why I would not claim that learning OpenTelemetry adds a fixed dollar amount to your salary. Compensation datasets do not isolate “manual instrumentation skill” from seniority, system-design ability, location, employer, or title.
For broader role and compensation context, see Refonte Learning's guide to the difference between a backend developer and a full-stack developer. The career value of OpenTelemetry is better described as evidence that you can own a production service after deployment, not as a salary multiplier with a credible standalone percentage.
The stronger interview signal is experiential: “I instrumented our checkout path, discovered that retries around a third-party authorization service explained the tail latency, changed the retry behavior, and verified the new trace.” That demonstrates backend ownership in a way that “I have used an APM dashboard” does not.
Self-Study vs. the Refonte Learning Backend Development Program
You can absolutely learn application instrumentation through self-study. OpenTelemetry's language documentation, semantic-convention specifications, example services, and vendor integrations are publicly available, and a small Node.js or Python API is enough to start experimenting.
The harder prerequisite is knowing your service well enough to recognize a meaningful boundary. If REST routing, database access, authentication, async execution, error handling, and testing are still opaque, adding a tracing SDK tends to create telemetry without insight.
That is where structured backend education and OpenTelemetry meet, not because a backend course automatically teaches observability, but because useful instrumentation extends ordinary backend design and debugging.
Factor | Self-study | Structured Backend Development Program |
Learning sequence | You design and maintain it yourself | Curriculum provides a predefined sequence |
REST/API boundaries | Depends on tutorials/projects you choose | Dedicated RESTful APIs and Microservices module |
Testing/debugging | Depends heavily on personal project discipline | Dedicated Testing & Debugging Backend Services module |
Authentication | Must be selected and sequenced independently | Dedicated Authentication & Authorization module |
Database fundamentals | Depends on chosen resources | MongoDB & SQL module |
Deployment context | Must assemble Docker/cloud learning separately | Dedicated Docker and cloud-platform module |
Portfolio structure | Personal project of self-defined scope | Capstone Project plus structured coursework |
Pace | Self-paced | Current page lists 3 months at 10–12 hours/week |
The timing in that table is based on the live Refonte Learning program page as reviewed on August 15, 2026. The page currently lists a three-month period and 10–12 hours of dedication per week, alongside hands-on projects and virtual-internship experience.
The Refonte Learning Backend Development Program currently lists eight curriculum areas:
Introduction to Backend Development
Node.js & Express Framework Essentials
Database Management: MongoDB & SQL
RESTful APIs and Microservices
Authentication & Authorization Strategies
Testing & Debugging Backend Services
Deployment with Docker and cloud platforms
Capstone Project
Those modules are listed on the live program page. The page also identifies MSc Sophia Johnson, Department of Product Design and Engineering, as an educational mentor and says she has more than a decade of software-engineering experience specializing in backend frameworks, databases, and cloud infrastructures.
There is an important honesty requirement here: the current published curriculum does not list OpenTelemetry, observability, tracing, monitoring, Prometheus, Grafana, or Jaeger as a module. You should not enroll on the assumption that this is an OpenTelemetry course.
The connection is foundational instead. The RESTful APIs and Microservices module teaches you to reason about service boundaries; Testing & Debugging Backend Services builds the debugging discipline required to ask where a request failed; database, authentication, and deployment modules give you real execution boundaries to reason about. The current curriculum verifies those modules directly.
Only after those boundaries make sense does a span such as checkout.place_order become more than a line copied from an OpenTelemetry tutorial.
The program page currently lists Backend Developer, API Developer, and Database Administrator under “Career Result”; those are better read as role directions associated with the program rather than guarantees of placement or a specific salary. The same live page says successful participants receive a Training Certificate and Certificate of Internship, with additional recognition available for qualifying high performers.
As reviewed on August 15, 2026, the live program page lists a USD 300 one-time enrollment cost or installments shown as USD 204 plus USD 98. Fees are inherently changeable, so prospective students should treat the live program page, not an archived article, as the current source of truth.
The practical choice is therefore straightforward. Self-study is strong when you already understand backend service design and can construct realistic exercises for yourself; a structured program is useful when you still need a coherent sequence through APIs, databases, authentication, debugging, deployment, and a capstone before application instrumentation will make much sense.
OpenTelemetry graduation does not reduce those fundamentals. If anything, it makes them more valuable: once a telemetry API becomes a durable part of production engineering, the ability to decide what deserves instrumentation becomes more important than memorizing how to initialize an SDK.
For developers who need that service-boundary and debugging foundation, the Refonte Learning Backend Development Program is the structured starting point.
FAQ: People Also Ask
What does OpenTelemetry's CNCF graduation actually mean?
CNCF announced OpenTelemetry's graduation on May 21, 2026, at the Observability Summit in Minneapolis. For OpenTelemetry, the graduation process included a third-party independent security audit, core-component reviews, and a formal governance review; CNCF also reported more than 12,000 contributors from more than 2,800 companies. It signals production maturity and mature governance, not that every OpenTelemetry feature has reached stable status.
Is OpenTelemetry only relevant to DevOps and SRE teams?
No. DevOps, SRE, and platform teams commonly own Collectors, telemetry infrastructure, APM administration, dashboards, and operational policies, but backend developers own the semantics of their business logic. OpenTelemetry's application APIs let developers create spans directly, while current Honeycomb guidance explicitly describes using OpenTelemetry to instrument your service's own business logic.
What is OpenTelemetry's declarative configuration?
It is a schema-driven configuration model whose key components reached stable status on March 5, 2026. The milestone included a stable JSON schema, YAML representation, SDK parsing/creation operations, and OTEL_CONFIG_FILE; at announcement time implementations were available in C++, Go, Java, JavaScript, and PHP.
What are OpenTelemetry Profiles?
Profiles are OpenTelemetry's emerging continuous-production-profiling signal, designed to stand alongside traces, metrics, and logs. Profiles entered public alpha on March 26, 2026, with an eBPF-based profiling agent integrated into the Collector ecosystem; OpenTelemetry explicitly warns that the alpha signal should not yet be used for critical production workloads.
Does OpenTelemetry support instrumenting LLM and AI calls?
Yes. OpenTelemetry defines GenAI semantic conventions for model operations, including attributes for requested model, input and output token usage, operation type, provider, and finish reasons. Its specification also warns that message and prompt content can contain sensitive or personally identifiable information, so content capture requires deliberate filtering and governance.
Does the Refonte Learning Backend Development Program teach OpenTelemetry?
No. The current published curriculum does not name OpenTelemetry or a dedicated observability module. It does include RESTful APIs and Microservices and Testing & Debugging Backend Services, which build the service-boundary and debugging fundamentals that manual application instrumentation extends.
The practical takeaway for backend developers:
OpenTelemetry's May 2026 CNCF graduation is a real maturity milestone, not proof of universal consolidation. CNCF reported large-scale adoption, security and governance review, while separate 2026 data still found 46.7% of organizations operating two or three observability tools and only 7.4% reporting a unified experience.
Declarative configuration and Profiles represent concrete 2026 technical progress. Declarative configuration gives SDKs a stable schema-driven configuration direction, while Profiles extends OpenTelemetry toward continuous production profiling, but remains alpha and unsuitable for critical workloads today.
GenAI semantic conventions move OpenTelemetry directly into modern backend business logic. When your service calls an LLM, standardized model, token, operation, and finish-reason telemetry can make that call observable as an application operation rather than an anonymous HTTP dependency.
The core skill remains yours to own: write meaningful instrumentation into the business paths you understand. A platform team can operate the Collector and your employer can change APM vendors, but neither can decide for you that payment.authorize, inventory.reserve, or agent.execute_tool is the domain boundary a future production investigation will need. OpenTelemetry's application API exists precisely at that code-level boundary.
For the service-boundary, API, and debugging foundation that instrumenting your own application code builds on, the Refonte Learning Backend Development Program provides a structured three-month backend curriculum with RESTful APIs, microservices, testing and debugging, deployment, and a capstone project.