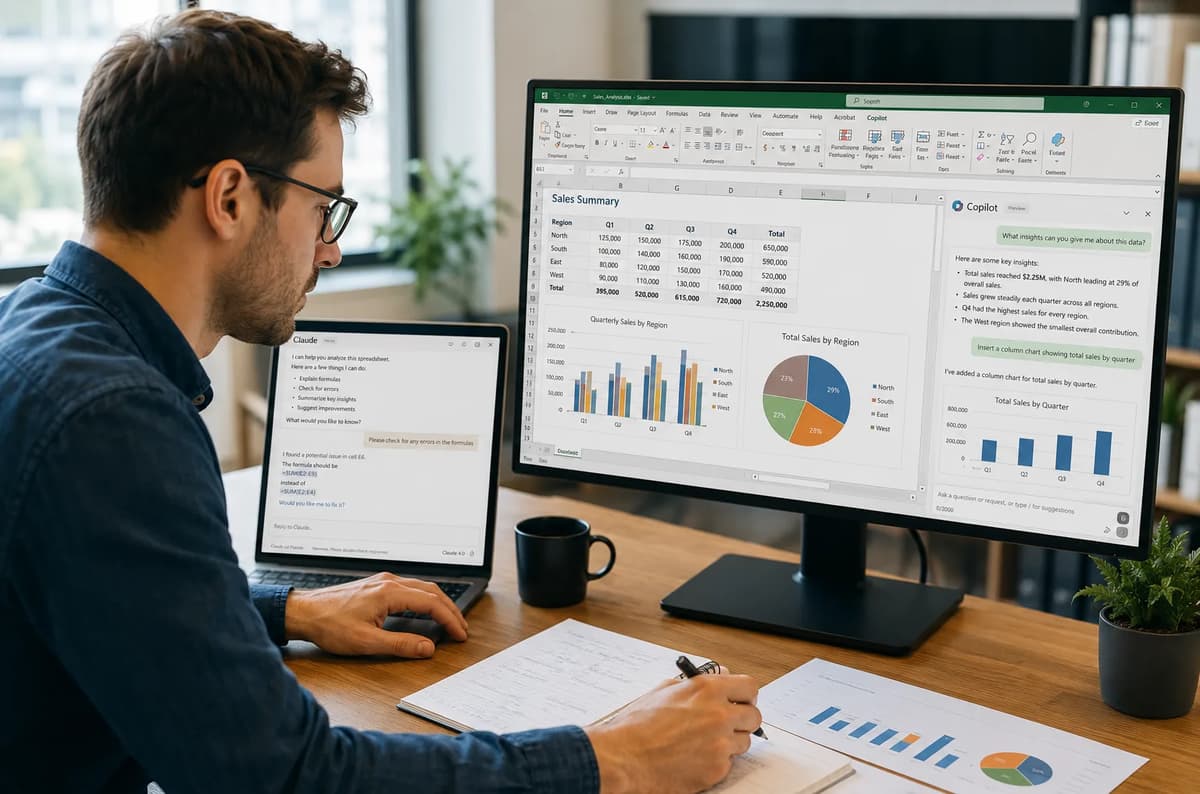
Imagine finding a subtle error in a complex financial spreadsheet, one you almost missed. Until now, catching such mistakes relied on human review: tracing formula dependencies by hand. But in late 2025 and early 2026, two major AI vendors quietly built AI agent assistants into Excel itself. Anthropic’s Claude for Excel add-in and Microsoft 365 Copilot’s new Analyst agent in the Copilot Chat app can now read your workbook, generate formulas, analyze data, and even debug errors, all with natural language commands. This change, which places a conversational agent directly on the spreadsheet, is not just another gimmick: it rewrites the data analyst’s workflow. In this article, we’ll trace the verified rollout timeline of both Claude’s and Microsoft’s new Excel agents, explain how their capabilities differ, and discuss the new on-the-job skill data teams must master (hint: it’s not just writing formulas anymore). (For a broad upskilling path, see the Refonte Learning Data Analytics Program and its focus on core Excel, Python, SQL and visualization skills, which provide the exact foundation you’ll need to validate an AI’s output.)
Two AI Agents Just Moved Into the Spreadsheet
In the past year, two AI agents in Excel for data analysts have emerged:
Claude for Excel (Agent Mode): Anthropic announced on Nov. 18, 2025 that its Claude models were integrated into Microsoft’s Foundry platform and Excel’s Agent Mode. In practice, this means Excel users can open a sidebar and say things like “analyze this table” or “generate a formula” and Claude (initially Sonnet 4.5, now Opus 4.6+) responds..
Microsoft 365 Copilot’s Analyst Agent: Microsoft’s own Analyst agent (released June 2, 2025) is an AI assistant that lives in the Microsoft 365 Copilot app (separate from Excel). It uses an OpenAI model (o3-mini) to reason across multiple attached data files and can execute Python code on the fly. It’s built for analysts who need to combine data from Excel, CSVs, databases, etc., rather than staying in a single workbook.
These tools look similar (AI that helps with data), but under the hood they’re different: Claude’s agent sits inside Excel as an add-in, understanding your open workbook, whereas Copilot’s Analyst is a Copilot Chat agent that can work with multiple files. In practice, Claude’s Excel integration excels at single-workbook tasks (explaining formulas, editing pivot tables, etc.), while Copilot’s Analyst excels at cross-file data exploration (aggregating CSV data, running Python queries, etc.). Below we’ll compare their scopes and design. First, though, let’s recap the timeline of Claude’s Excel rollout, as it unfolded in 2025–2026.
Claude for Excel: The Full 2026 Rollout Timeline
Anthropic’s “Claude for Excel” add-in moved quickly from hidden beta to broad availability. Important dates include:
Oct 2025 (Beta): A small research preview of Claude for Excel launched in October 2025, limited to about 1,000 testers on Max/Enterprise plans. It could already “analyze, edit, and comment on tables” in Excel.
Nov. 18, 2025 (Announcement): Anthropic officially announced Claude’s integration into Microsoft’s ecosystem (Foundry models and Excel Agent Mode) at Microsoft Ignite 2025. They touted features like generating formulas, analyzing data, and identifying errors inside Excel.
Jan 24, 2026 (Pro Access): The Decoder reported on Jan. 24, 2026, that Anthropic had activated Claude’s Excel integration for all Pro subscribers. From that date, any user on the $20/month Claude Pro plan could install the add-in from the Microsoft Marketplace. The update also brought improvements like drag-and-drop file import and longer sessions.
Feb 5, 2026 (Opus 4.6 Update): Claude’s Excel add-in was upgraded to use Claude Opus 4.6. This release added native Excel operations: Claude could now modify pivot tables, charts, conditional formatting, sort/filter, and data validation directly. (Previously it could read static pivot tables but not change them.) This update significantly expanded Claude’s editing capabilities.
Feb 17, 2026 (MCP Connectors): Shortly after, on Feb 17, Claude in Excel gained support for Model Context Protocol (MCP) connectors. Analysts could now pull live financial data (S&P Global, PitchBook, etc.) directly into Excel through Claude.
Mar 11, 2026 (Skills & Cross-App Context): Anthropic added a “Skills” feature on March 11, 2026, letting users create one-click workflows shared between Excel and PowerPoint. Claude’s Excel add-in also started preserving context across open files: you could switch from editing an Excel sheet to a related PowerPoint and Claude would remember the conversation.
May 7, 2026 (General Availability): On May 7, 2026 Claude’s Excel, Word, and PowerPoint add-ins all reached general availability. (Outlook got a beta separately.) Anthropic emphasized that Claude could now move with full context across the four apps, carrying its “conversation” state from Excel into Word or slides.
Below is a concise table of the Claude-in-Excel timeline:
Date | Event | Notes |
Oct 2025 | Private Beta | Excel add-in launched for about 1,000 testers (Max/Enterprise plans). |
Nov 18, 2025 | Ignite Announcement | Claude in Excel (Agent Mode) announced (preview). |
Jan 24, 2026 | Public Beta (Pro) | Claude add-in activated for all Pro subscribers. |
Feb 5, 2026 | Opus 4.6 Upgrade | Pivot tables, chart editing, conditional formatting added. |
Feb 17, 2026 | MCP Connectors | Real-time data connectors (finance data) enabled. |
Mar 11, 2026 | Skills & Cross-App Mode | Excel/PowerPoint share context, one-click “Skills” workflows added. |
May 7, 2026 | General Availability (GA) | Claude for Excel, Word, and PowerPoint reached GA; Outlook remained in beta. Excel Agent Mode was live for all. |
The bottom line: as of mid-2026, any organization with Microsoft 365 or Anthropic subscriptions can tap into Claude inside Excel to assist with data tasks. (Just remember: usage is metered by tokens, so heavy use of this copilot will show up on your invoice.) And as we’ll see, Microsoft’s own competitor arrived a bit earlier in a different way.
What Claude’s Excel Agent Mode Actually Does
Claude’s Excel add-in works like an intelligent sidebar for your workbook. You might click a button or press a shortcut and simply ask Claude a question about your sheet. It uses a large language model with Excel-specific capabilities, so it “reads” every tab, formula, and cell reference in your workbook. For example, you could open a complex 15-sheet financial model and ask, “How is Q3 revenue calculated?” and Claude will trace through the sheets and reply with the source cells and formula logic. According to testers, Claude will answer in plain English with clickable references (you can jump straight to the source cell).
In practice, Claude for Excel offers these core functions (among others):
Explain and Audit Formulas: Claude can explain any formula in your sheet, even deeply nested ones, in everyday language. It effectively traces dependencies across sheets and shows you the chain of logic. Users report it can do in ~30 seconds what might take an analyst 20 minutes of clicking.
Generate New Formulas/Calculations: Need a formula to compute a metric? Tell Claude in English (e.g. “total sales plus expenses”) and it will write the formula. It can also create new pivot tables, charts, or tables from data on the fly.
Identify and Fix Errors: If your sheet has errors (#REF!, #VALUE!, etc.), Claude can “debug” them: it points out what caused an error and suggests fixes. Every change Claude makes is shown to you first, so you can accept or adjust it.
Data Cleaning/Transformation: Claude can clean messy data (remove duplicates, reformat columns, parse dates), apply conditional formatting, sort/filter, and similar tasks via natural-language requests.
Cross-Tab Updates: When you change a number or assumption via Claude, it updates related formulas and charts automatically, preserving dependencies. For example, you could say “increase marketing spend by 10%” and Claude adjusts the inputs and all downstream calculations.
Collaboration (Pro feature): On Pro/Max plans, Claude can share context across Excel and PowerPoint. It remembers the conversation as you move between files, and offers saved “Skills” (templated workflows) that you can apply with one click.
Critically, Claude shows its work. Every suggested edit or formula comes with a transparent explanation before you apply it. This means you can audit its logic in real time. In short, Claude for Excel is like having an instantly-available colleague who has memorized your entire workbook. It shines at reading and understanding existing models (auditing, documentation, debugging). It can even generate new models or pivot tables from scratch.
However, it’s not magic: it doesn’t replace expertise. Complex edge cases (circular references, very intricate macros/VBA, or highly customized spreadsheet models) may still confuse it. Its advice should still be sanity-checked by a human (we’ll get into that). Still, for day-to-day analyst work, including answering questions about the data, building routine pivot charts, and documenting models, Claude’s Excel agent can cut work hours dramatically. In one test, generating a “Sales by Region” pivot table with Claude took about 3 minutes, whereas doing it manually, especially for less experienced users, could take much longer. One real-world report even said a team “saved 15 hours” on data cleanup by using Claude in Excel.
In short, Claude for Excel: an in-app assistant that generates formulas, audits tables, cleans data and answers natural-language queries about your workbook. It’s best suited for someone who already has a model or data and wants to understand or tweak it quickly.
Microsoft Copilot’s Analyst Agent, Explained
Microsoft’s approach is built on the Copilot framework. In mid-2025 Microsoft introduced two reasoning agents in its Microsoft 365 Copilot app: Researcher (for deep multi-step information gathering) and Analyst (for data crunching). The Analyst agent reached general availability on June 2, 2025 and is powered by an OpenAI o3-mini model.
Key features of the Analyst agent:
Multi-File Data Ingestion: Users start by attaching data files (Excel workbooks, CSVs, database connections, etc.) in the Copilot Chat interface. Analyst then can pull from multiple sources at once. For example, you might attach last quarter’s sales spreadsheet, a customer list CSV, and a CSV of product information, then ask Analyst to “compare region sales versus targets” or “identify underperforming products.” It will load all attached data and compute answers.
Chain-of-Thought + Python Execution: Analyst uses “chain-of-thought” reasoning to break the problem into steps. Crucially, it can write and run Python code on your data behind the scenes. It actually shows you the generated code (with a “View Code” button) so you can verify how it computed things. This transparency is a selling point: you’re not just getting an answer, you can inspect the exact logic.
Natural Language Queries: You ask Analyst questions in plain English, just like with Claude. For example, common prompts include “Compare sales by region and quarter and highlight key trends” or “Identify our top customers who aren’t fully using the products they've purchased.” Analyst will then pivot, group, chart, and highlight as needed, delivering a written summary plus charts/tables.
Insights & Visuals: The output is typically a short narrative plus visual elements (tables, charts) embedded in the Copilot Chat. For instance, Analyst might “pivot raw rows into a clean table” and also draw a bar chart.
Query Limit: By default, each Microsoft 365 Copilot license includes a combined limit of 25 Analyst+Researcher queries per month. This is not a per-day limit but a monthly quota, subject to change. Heavy users may need to watch their usage.
In practical terms, the Copilot Analyst agent is like having a virtual data scientist who you feed all relevant data. It excels at tasks like: merging data from several sources; running statistical summaries; finding correlations; spotting anomalies; and automating visualization creation. Early adopters have used it to quickly see how a price discount affected customer retention, or to pull sentiment trends from a large feedback dataset.
Importantly, Analyst is distinct from “Copilot in Excel.” The latter is the familiar sidebar AI that works on a single open workbook (introduced earlier and also a Copilot product). Analyst in Copilot is specifically built for the cross-file, multi-source job. As one Microsoft author put it, Analyst is to datasets what Researcher is to web research: both are reasoning agents under the Copilot umbrella.
How Analyst Differs From Copilot in Excel
Feature | Copilot (in Excel) | Analyst Agent (Copilot) |
Data Scope | Works on the single open workbook. (Data must be in that Excel file.) | Can pull together multiple files (Excel, CSV, databases) attached to the Copilot session. |
Model | Based on GPT-4o or similar (frontier model) under the Copilot in Office license. Context limited to current sheet. | Built on OpenAI o3-mini reasoning model, optimized for data tasks. |
Code Execution | No; generates Excel formulas natively. (You do not see code.) | Yes; runs Python on your data. You can view the generated code in real time to verify logic. |
Chain-of-Thought | Implicit, limited to formula logic. Not explicit in UI. | Explicit chain-of-thought reasoning; breaks tasks into steps. Also shows reasoning via code comments/output. |
Users | Invoked inside Excel by workbook users. | Invoked in the Copilot Chat app by any user with Copilot license. Works best for data analysts and managers combining sources. |
Limit | Constrained by Copilot’s context window; no fixed query count limit (aside from overall Copilot usage quota). | Shared limit with Researcher: 25 queries/month per user (as of GA). |
Output | Answers appear in the Excel task pane (sidebar), can create new cells, formulas, charts in the workbook. | Answers appear as a report in Copilot Chat (text, tables, charts). Cannot directly edit Excel cells (though you can copy results back). |
This table highlights that Analyst is built for cross-file consolidation and verification (you see the Python code), whereas Copilot in Excel is built for in-sheet help without exposing code.
Cross-File Reasoning vs. Single-Workbook Assistance
In practice, you’d choose Analyst when your question involves data from multiple sources. For example, “I have sales.csv and inventory.xlsx: compare units sold versus stock by product category.” You would open Copilot Chat, attach both files, and ask Analyst to cross-compare. Analyst will combine and crunch. By contrast, Claude in Excel is ideal when all data is in one workbook. You might ask Claude, “Summarize sheet ‘Expenses’ for Q1” or “Audit this budget model,” for tasks fully inside the open file.
The key difference: Analyst can say “here are the results from combining these two spreadsheets,” whereas Claude can manipulate the very cells of a single sheet. Analyst yields consolidated insights and charts; Claude yields in-place edits and explanations.
Benefits of multi-file (Analyst) vs single-file (Excel agent) can be listed:
Analyst (Cross-file):
Attach diverse data (Excel, CSV, DB).
Get aggregated summaries across tables.
Run more complex analyses with Python.
Best for “data lake” style queries (e.g., demographic analysis, multi-dataset joins).
Excel Agent (Single file):
Everything happens inside one workbook; continuity of context.
Edits the actual spreadsheet (formulas, formatting) in real time.
Best for “models and reports” (e.g., financial models, operational dashboards) where the spreadsheet itself is the final output.
No need to export/import data; just talk to your current sheet.
In our experience, even if both could answer a similar query, Analyst’s approach will be cross-file coding vs Claude’s approach of one continuous spreadsheet conversation. This distinction is crucial: you wouldn’t use Analyst to fix a broken VLOOKUP in the open Excel sheet. You’d use Claude. And you wouldn’t use Claude to join sales data from different departments that live in separate files.
What These Agents Get Right and Where They Still Need a Human
These new AI agents are powerful helpers, but they aren’t perfect. Here’s what they tend to do well, and where they still struggle:
What they do well (pros):
Understanding structure: They “read” all visible data and formulas, so they rarely miss an obvious dependency.
Speedy analysis: They can summarize large tables or find correlations much faster than a human clicking around.
Error spotting: By checking formulas logically, they often catch common mistakes (wrong ranges, broken links) instantly.
Natural language bridge: A user who’s not an expert in Excel formulas or SQL can still ask a question in plain English and get a working solution.
Reusability: The “Skills” workflows let analysts package common sequences (e.g. “audit this invoice template”) into one-click actions, saving time.
Where humans still matter (cons/caveats):
Checking correctness: These models still make probabilistic guesses. They can hallucinate or apply the wrong formula if misled. A user report noted Claude kept insisting on a data-table formula even when another method was correct. You must verify outputs.
Context understanding: AI might not know the real-world meaning of your data (e.g. what “revenue” really includes). It follows patterns, so it may misinterpret domain-specific logic without human guidance.
Edge cases and nuance: Complex macros, obscure Excel features, or non-standard data formats can confuse them. For now, they handle “normal” spreadsheets best.
No ambition/policy judgment: The agent won’t question a request ethically or strategically. You still need human oversight to decide if an analysis is relevant or if it violates rules.
In short: these tools augment data analysts, but don’t eliminate them. A good analogy is having a very fast intern who does the grunt work of calculation, who even explains the steps, but who still needs your career’s expertise to interpret and double-check results.
Why “You Can See the Code” Matters
A key feature of Copilot’s Analyst is that you can view the Python code it generates. Why is this important? Because it means you can verify the logic step-by-step. Instead of taking the answer on faith, you can inspect how exactly it aggregated or filtered the data. For example, Analyst might show a bar chart of sales by quarter, and you can click “View Code” to see the exact Pandas or NumPy code used to group and sum the data.
This feature brings data scientists’ best practices into AI:
You can debug the debugger. If something looks off, scan the code for logic errors.
You learn from it. Analysts can improve their own Python skills by seeing the agent’s code.
It creates trust. Even non-technical managers can glimpse that “yes, these figures came from real operations on the data.”
Microsoft explicitly touts this transparency. By contrast, Claude’s Excel agent keeps its reasoning under wraps (just outputs explanations in English). So when using Copilot’s Analyst, a safe habit is to always look at the underlying code, just as you’d review a colleague’s spreadsheet formula step.
Ultimately, the new superpower here is not just writing formulas, but reading generated code or formulas. The role of a data analyst shifts from crafting every formula by hand to verifying, auditing, and steering the AI’s output. We’ll explore that shift next.
The New Analyst Skill: Verifying an Agent’s Output
With AI agents doing more of the heavy lifting, a core data analyst skill in 2026 is sanity-checking AI-generated work. Employers now expect analysts to:
Validate calculations: When an agent gives a result (sum, forecast, analysis), you should plug a few numbers back into Excel or a calculator to confirm plausibility. Did the AI include all relevant categories, or accidentally skip a column?
Inspect logic: For Copilot/Analyst code, scan through it. Is it using the correct filters? For Claude/Excel, ask it to explain the formula in detail (Claude provides clickable tracebacks). If an explanation doesn’t match what you know, probe further.
Ask for citations: Both Claude and Copilot display source references for data. Use “Show sources” or similar buttons to ensure the data came from the right rows.
Test edge cases: Sometimes a quick way to check a formula is to alter input values (in a duplicate sheet) and see if outputs update logically. This is as important as ever.
Document manually: Even if the agent “writes the spreadsheet,” you still need to document assumptions in reports. Use the AI’s English summary, but then phrase it in your own terms for stakeholders.
In practice, a good workflow might be: AI drafts; the analyst reviews line by line; the analyst tweaks or rejects changes; then the work receives a final polish.
For example, one common request might be “Create a sales forecast for Q4.” The AI might output a pivot or chart. The analyst’s job: check that the time periods align, that no sales channel is omitted, and that the trend it projected makes sense given past seasonality. If something looks too optimistic, the analyst might override or rerun with adjusted prompts.
In hiring or evaluation, companies will test not only your Excel skills but your ability to “debug an AI’s analysis.” They may give you an AI-generated Excel report and ask you to find any mistakes. Or they may ask you to review a block of Python from Copilot. Being able to catch an error is now as valuable as writing a clever VLOOKUP. We’ll cover what employers might look for below.
Formula Auditing and Error-Checking as a Core Competency
Even before AI, auditing spreadsheets was a specialized skill. Now, it’s indispensable. Every data team will need analysts who can systematically check and document formulas and outputs. Here are some bullet points on what that entails:
Master Excel’s auditing tools: Use Trace Precedents/Dependents, Error Checking, and Watch Window to see formula flows. Confirm that the agent’s formulas didn’t break any links.
Version control mindset: Keep original copies of sheets before letting AI modify them. Compare “before vs after” to catch unintended changes. Tools like Spreadsheet Compare (where available in Office) or manual diff can help.
Peer review practices: Collaborate like coders do: one person prompts the AI, another reviews the output. This double-check mimics code review.
Scenario testing: Plug in extreme or boundary values to see if formulas still hold. If an AI-created formula sums cells F1:F10, check if all intended cells are included (maybe the source data added a new row).
Document findings: Keep a changelog of what the AI did and what you (the analyst) adjusted. This not only aids transparency but teaches the AI (via feedback) for next time.
By making auditing a standard part of your workflow, you ensure that AI is a tool that augments accuracy, not one that propagates errors unchecked. This expertise, especially spotting where a formula chain goes awry, will be in high demand.
How This Changes Entry-Level Analyst Work
What about junior analysts or interns? Traditionally they might have spent their first months writing basic formulas or preparing routine reports. With AI agents:
Less grunt work: Some everyday tasks (like “clean this data table” or “describe this dataset”) can now be done much faster with AI help. An entry-level analyst using Claude might spend minutes asking for a pivot instead of hours clicking.
More oversight from day 1: Instead of just writing formulas, a newcomer might spend more time reviewing AI-generated work. For example, a manager could assign a junior analyst to “verify the AI’s answer to this data question.” This means even newbies need to understand what makes an output correct.
Learning shifted: Entry analysts will spend time learning how to craft effective prompts, read AI outputs, and use tools like the “View Code” feature. They still need foundational skills, but the training will include how to use Copilot and Claude responsibly.
Faster competence growth: On the plus side, an intern can get to meaningful analysis much earlier. Even without deep formula knowledge, one can ask Claude, “show me the trend in sheet Sales,” and immediately grasp insights. This accelerates learning.
New kinds of errors: Junior staff will need to learn to spot AI-specific pitfalls (like overreliance on defaults, or missing the context an AI doesn’t know). A subtle formula error by a colleague is one thing; having to debug a hallucination by an AI is another challenge.
In sum, entry-level roles will evolve from being “formula factories” into “AI overseers and data detective assistants.” Firms may start expecting even new hires to be comfortable with Copilot/Claude interfaces as basic tools, just like they expect them to know Excel.
What Employers Are Actually Testing For Now
Companies updating their analytics teams will tweak their hiring criteria. Beyond Excel or SQL proficiency, they’ll look for:
Prompt engineering skill: The ability to ask the AI agent the right questions. During interviews, they might simulate Copilot sessions or ask, “How would you use an AI agent to find X in a dataset?”
Code-reading ability: Expect questions on interpreting Python or pseudo-code. For example, they might show a short script (or an AI chat log) that processes data and ask you to spot what it does or potential bugs.
Formula skepticism: They might give you an AI-generated Excel formula or output and ask you to audit it. Can you spot if the formula references the wrong cell range or if a sum omitted a column?
Data interpretation: Even if the AI generates an insight, an employer will test if you can contextualize it. “The agent says sales will grow 20%: why might that be unrealistic?”
Traditional skills still matter: Don’t expect companies to drop Excel or SQL from requirements. In fact, they may test these skills by mixing AI: e.g., “Write an SQL query, then convert it to a plain-English question for Copilot.”
Reading Generated Code, Not Just Writing Formulas
A specific example: Microsoft’s documentation notes that Analyst’s ability to run code is new to many users. In an interview, a recruiter might show you a piece of Python that Copilot wrote (e.g., df.groupby('Region')['Sales'].sum()) and ask what it does. Alternatively, they might ask you to explain a complex nested Excel formula the way Claude would.
The upshot is that code literacy is now part of the data analyst’s essential toolkit, even for “analyst” roles rather than full data science. Being able to quickly scan and verify code output (or an AI’s English explanation of logic) is as important as knowing the functions themselves.
Where AI-in-Excel Fits Alongside BI-Tool Copilots
Excel isn’t the only place AI helpers have shown up. Business Intelligence tools like Power BI, Tableau, and Looker have their own AI copilots that can suggest insights in dashboards. (Refonte Learning has covered BI-tool copilots in its Data Analytics in 2026: Trends, Tools, and Career Opportunities and AI-Driven Insights in Power BI Dashboards articles.)
The difference: those BI copilots summarize data present in dashboards and help build visuals, but they generally don’t edit the underlying data model. Claude in Excel and Analyst are directly manipulating or analyzing raw data. You might use BI Copilot to highlight a pattern on a report for executives, but use Excel’s agent to fix the raw spreadsheet that feeds that report.
To put it another way:
BI Tool Copilots: Great for generating narrative descriptions of your dashboards, suggesting chart types, or writing DAX/SQL snippets. They assume your data is already loaded in a BI system. These were covered in our trends article for corporate BI teams.
Excel Agents: Focused on the spreadsheet layer. They generate formulas, pivot tables, or Python analyses that become part of your data pipeline. Excel agents blur the line between data cleaning and analysis.
The advent of Claude/Analyst doesn’t make BI copilots obsolete; it shows that every level of data tooling is getting smarter. An analyst might first use Claude to shape and verify the data in Excel, then refresh a Power BI report and use the Power BI Copilot to present the findings.
In this context, it’s worth noting that Refonte Learning’s Data Analytics Program covers Excel (advanced) and tools like Tableau and SQL, which lays the groundwork for both worlds. We teach robust analysis skills that can be applied whether the front-end is a spreadsheet or a BI dashboard. (We do not specifically teach “how to use Claude”; instead we focus on the fundamental skills that let you spot an AI’s mistakes and interpret its answers. These skills are in even higher demand now.)
Common Misconceptions About “AI Replacing Analysts”
There’s hype and confusion about AI’s role. Let’s clear up a couple of misconceptions:
Myth: “AI agents will do the whole job.” Reality: Even if an agent can produce a draft analysis in seconds, it’s only a first pass. The human analyst still decides which questions to ask, which data matters, and whether the answer makes sense. Think of the agent as a super-fast intern, not an independent consultant.
Myth: “Everyone’s productivity is up 10x.” Reality: Some tasks are faster, but polishing an agent’s output can take time too. Also, not all analytics tasks are suited to these agents. Custom modeling (complex machine learning) often still requires a human (or a specialized tool like Snowflake Cortex). Use the right tool for the job: agents for exploratory analysis and error-checking; skilled analysts for building predictive models or designing a data architecture.
Myth: “Data analysts’ salaries will drop because of AI.” Reality: Demand for data analysts remains high, and salaries are not falling. (See below.) If anything, companies will pay more for analysts who have AI fluency.
What the Anthropic Economic Index Actually Shows
A useful piece of context (though not specific to data analysts) is the Anthropic Economic Index (March 2026 report). It analyzed Claude usage by occupation and found that “Computer and Mathematical” occupations account for 35% of Claude.ai conversations. Also, roughly 49% of occupations use Claude for at least 25% of their tasks.
It’s important to interpret this correctly: those stats mean Claude is already used widely in tech and math fields. It doesn’t say half of an analyst’s job is done by AI. It mostly shows early adopters are heavily using AI for their tasks. Many knowledge workers will gradually incorporate these tools into 25–50% of their workflows as they become comfortable.
For data analysts, this suggests that by 2026 it’s likely AI will assist in a large share of routine work, but the human will still handle interpretation and higher-level strategy. The Index’s broad numbers validate that AI is spreading in our field, but not that “AI replaced X% of analysts.” Use it as a sign that your peers are using Claude for analysis tasks, and that you shouldn’t be left behind in learning these tools. But don’t misread it as “jobs are gone.”
Data Analyst Salaries in 2026
With all these changes, how are analysts compensated? Recent salary data gives a range:
Glassdoor indicates US data analysts earn on average around $90–94K/year, with base pay typically between $60K and $98K and total pay (including bonus) in that range. The 25th–75th percentile range is roughly $72K–$122K.
Indeed (Aug 2026) reports an average base salary of about $86,700/year + $2K bonus for US data analysts.
ZipRecruiter (Aug 2026) shows a similar figure: average about $82,640/year for Data Analysts.
PayScale (self-reported data) has a lower figure: around $70,643/year. This number skews lower, since PayScale collects individual (often entry-level) salary submissions.
These discrepancies reflect data sources: Indeed and ZipRecruiter scrape postings (often requiring more experienced hires), Glassdoor includes bonuses and high earners, and PayScale surveys a broad population (including many juniors). In short, expect roughly $80–90K as an average US salary for a data analyst in 2026, with significant variation by experience and location. (Senior data analysts and data scientists can earn well above six figures, as Glassdoor’s “total pay” ranges show.)
The key point: Organizations are still willing to pay handsomely for data analysis skills, and those skills now include AI collaboration skills. Being able to harness and check Copilot/Claude effectively is likely to be a salary driver, not a detractor.
Building the Underlying Skill Set: The Refonte Learning Data Analytics Program
None of the above changes obviates the fundamentals. The real long-term advantage is in mastering data analytics competencies themselves. The Refonte Learning Data Analytics Program is designed precisely for this, giving you the experiential foundation needed to thrive alongside AI.
Refonte’s 3-month program covers all the core tools and techniques:
Excel (advanced) – deep mastery of spreadsheet formulas, pivot tables, and data manipulation.
Python & R – for programmatic analysis beyond spreadsheets.
SQL – querying databases, which complements Excel for larger data.
Tableau (and BI tools) – building visual dashboards.
Statistical modeling and ML – the mathematical background behind insights.
Plus a virtual internship component: real projects with mentor guidance (led by Dr. Helena Ferreira, a veteran analyst).
Although we don’t (and cannot) teach “how to click a Copilot button,” our curriculum explicitly includes those underlying skills that such AI agents require the human to bring. As Claude or Analyst crunches numbers, it relies on you to know which numbers to include, which models make sense, and how to act on the results. The program’s focus on EDA, SQL, Python, Excel, and Tableau directly builds the expertise you’ll use to verify agent outputs.
In your career outcome, you will be ready not just to create reports, but to guide AI in making them. That’s what employers want: analysts who can ask the right questions of an AI and then ensure the answers hold water. Learning how to read formula logic or Python code generated by these agents is essentially applying the same analytical reasoning we teach (just in a different interface).
In summary: The move to AI agents in Excel is a sea change in everyday workflow, but the role of the analyst is still crucial. The timeline of Claude’s Excel integration and Copilot’s Analyst agent rollout (2025–2026) shows these tools are real and here now. They will make many tasks faster, but they also raise the bar on critical skills: auditing, coding literacy, and domain judgment. Data analysts who combine traditional chops (Excel, SQL, stats) with savvy oversight of AI will be in highest demand.
Build the fundamentals needed to direct and verify spreadsheet AI with the Refonte Learning Data Analytics Program.